Update: Watch a 15 minute talk about this package:
https://kbod.win/talks/user_2020
https://youtu.be/sXFJ_AZ4jeA
It is my distinct pleasure today to introduce you to the flair package.
The following is an example of the type of classroom disaster that motivated this package:
You are presenting an analysis to a class or audience, and you turn to a slide where you show both source code and its output. Because you wanted to emphasize a line of the source code, you copy-pasted the code text into the slide, and added highlighting to the relevant section.
Upon opening the slide, you realize with creeping horror that you made a change in the source code, but you forgot to edit your slide. The code text displayed on your screen no longer matches the output, and your students are confused.
Was this relatable? Have you, too, lived out this horror story?
This kind of un-reproducibility of materials, and the simple frustration of the fiddly nature of manually highlighting code text, led me to develop flair. I wrote this package first and foremost for educators, although I have found it equally useful for conference talks and workshops.

You can find the basic package documentation and vignettes at this site. Today, though, I want to take the time to show you a few of my favorite examples of flair in action, to give you an idea of how it might be useful in your classroom or presentation.
These examples all use the baby_names dataset from
https://www.kaggle.com/kaggle/us-baby-names, which contains counts of babies born with each given name, in each state, since the 1800s. We’ll restrict our data only to babies born in California with the first name “Kelly”. You can download
this data to follow along.
Example 1: Emphasize small differences in code.
The most default ability of flair is quickly adding basic highlighting to code.
There are a lot of use cases of this simple functionality. I am particularly fond of using the flair() function to show how small changes in code impact the output.
For example, suppose I am teaching the concept of geometries in ggplot. I wish to plot the number of babies born each year with the name “Kelly” in California, colored by gender assigned at birth.
I have made two different plots; one using columns, and one using lines. The code chunk for my work looks like this:
```{r geoms, include=FALSE}
baby_names %>%
  ggplot(aes(x = Year, y = Count, fill = Gender)) +
  geom_col()

baby_names %>%
  ggplot(aes(x = Year, y = Count, color = Gender)) +
  geom_line()
```
With the decorate and flair functions, I can trigger this code chunk to be evaluated, while simultaneously adding highlighting to the chosen parts of my code.
Ordinarily, we would use echo = FALSE on the first chunk below, so as not to see the flair() process.
decorate("geoms") %>%
  flair("_col") %>%
  flair("fill = ") %>%
  flair("_line") %>%
  flair("color = ")
baby_names %>%
  ggplot(aes(x = Year, y = Count, fill = Gender)) +
  geom_col()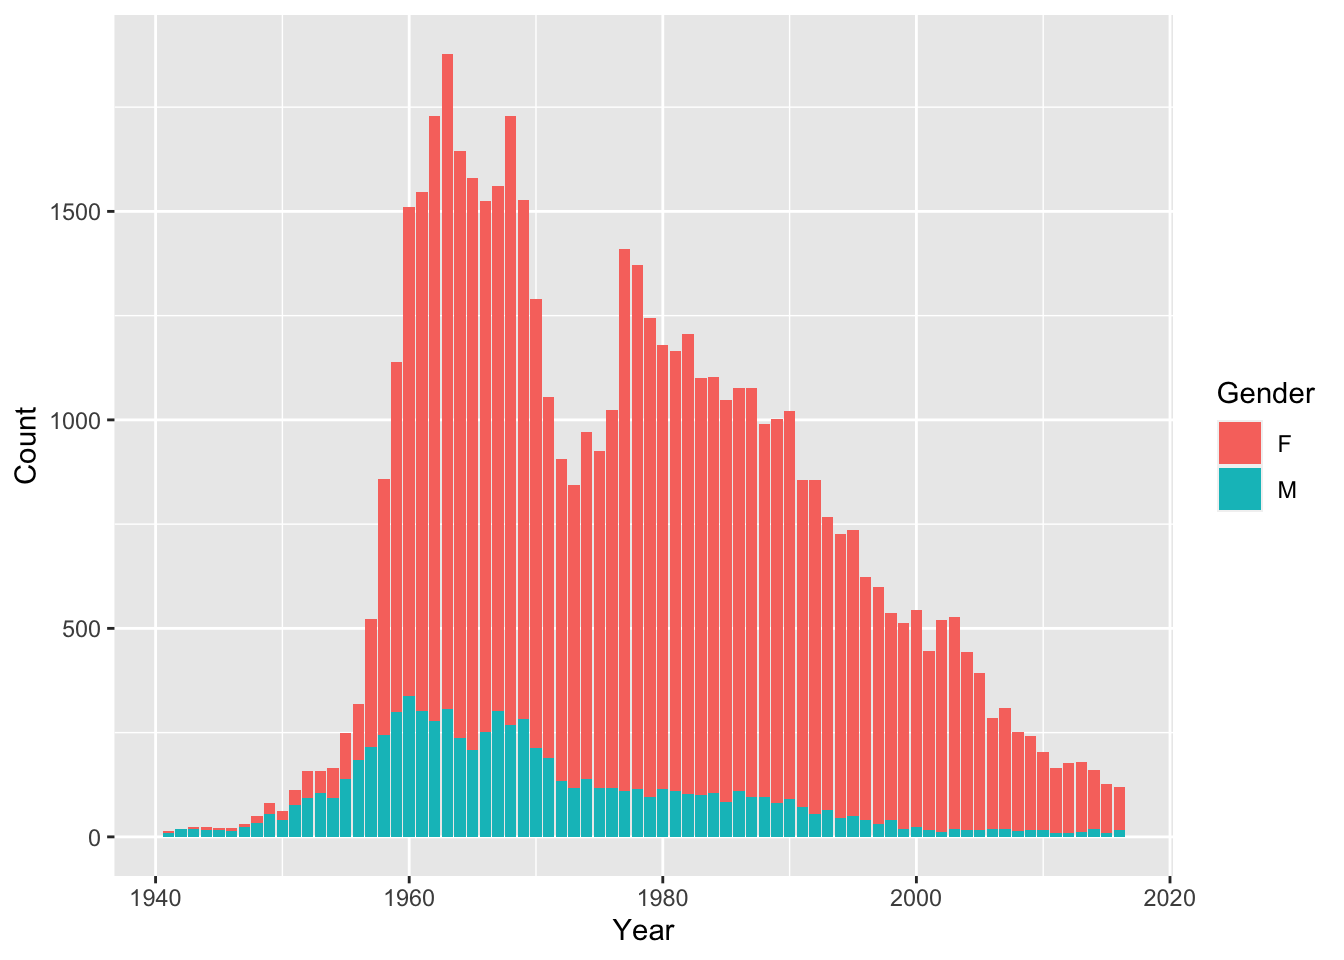
baby_names %>%
  ggplot(aes(x = Year, y = Count, color = Gender)) +
  geom_line()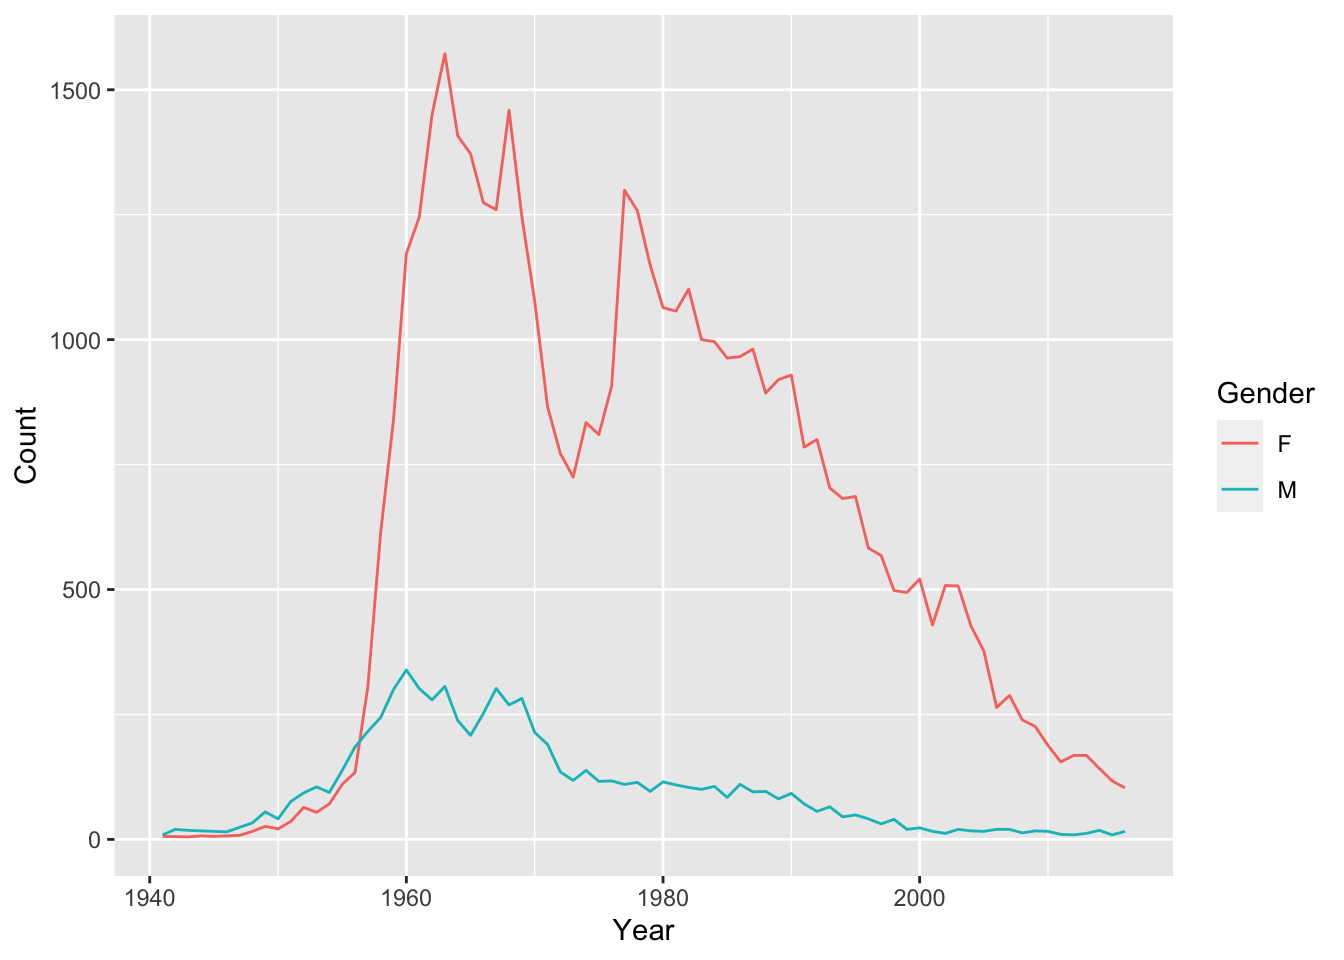
Note: If you have many pieces of code to flair, and you don’t want to manually specify everything, the flair_rx() function lets you input regular expressions instead of fixed strings.
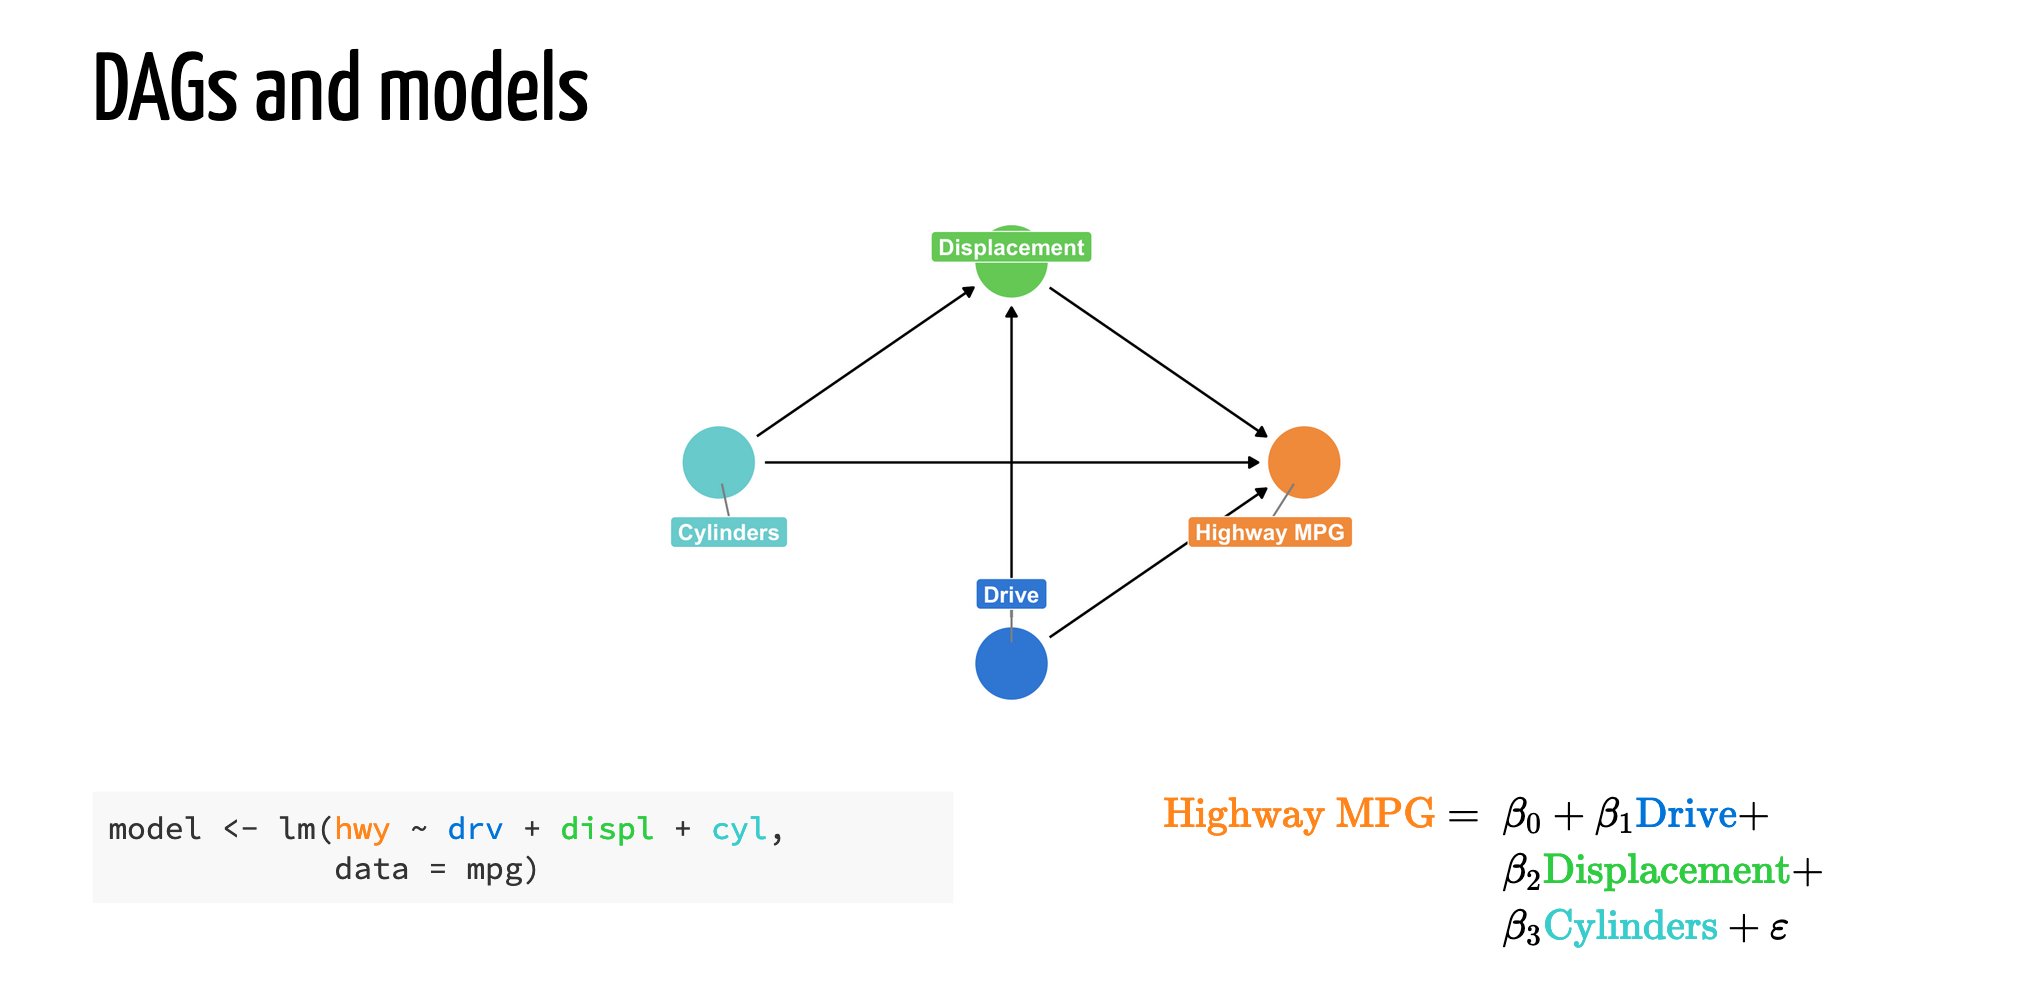
Example 2: Match colors to concepts.
When teaching, we often want to link concepts to code, like in this beautiful flair-created slide by Andrew Heiss:
Coloring different pieces of your code different colors is straightforward with flair(). For an extra shortcut, you can also pipe strings though the flair functions to color parts of your text, and even
add your own special html tags if you wish.
Code Chunks:
```{r, results = "asis", echo = FALSE}
"This model has a response variable, two predictors, and an interaction term." %>%
  flair("response variable", color = "deeppink") %>%
  flair("predictors", color = "cornflowerblue") %>%
  flair("interaction term", color = "orange") %>%
  flair_all(before = "<h4>", after = "</h4>") %>%
  cat()
```
```{r, echo = FALSE}
decorate("lm") %>%
  flair("Count", color = "deeppink") %>%
  flair("Gender:Year", color = "orange") %>%
  flair_rx("Gender |Year ", color = "cornflowerblue")

```
Results:
This model has a response variable, two predictors, and an interaction term.
mod <- lm(Count ~ Gender + Year + Gender:Year, data = baby_names)

summary(mod)
##
## Call:
## lm(formula = Count ~ Gender + Year + Gender:Year, data = baby_names)
##
## Residuals:
##     Min      1Q  Median      3Q     Max
## -625.27 -128.36  -13.67  155.13  943.86
##
## Coefficients:
##               Estimate Std. Error t value Pr(>|t|)
## (Intercept)   837.0953  3555.4360   0.235    0.814
## GenderM      2769.6513  4980.9342   0.556    0.579
## Year           -0.1064     1.7965  -0.059    0.953
## GenderM:Year   -1.6660     2.5171  -0.662    0.509
##
## Residual standard error: 337.2 on 147 degrees of freedom
## Multiple R-squared:  0.3876,	Adjusted R-squared:  0.3751
## F-statistic: 31.02 on 3 and 147 DF,  p-value: 1.357e-15
Example 3: Mask code for easy practice activities.
Last but not least, my absolute favorite usage of flair is the mask() function
for hiding segments of code. This feature was originally suggested by Alison Hill,
and it has quickly become my most-used function in the package!
Suppose I am teaching ggplot, and I want students to understand the Grammar of
Graphics framework. I would like for them to have practice identifying a few key
elements of the plot:
- Which variables are being used for which aesthetic elements.
- Which geometries are being used to make the plot.
- Which
theme_*()function is being applied to the plot.
Thus, I can create the following challenge: Fill in the code blanks, based on the plot output.
library(ggplot2)

baby_names %>%
  ggplot(aes(y =      , x =     , color =       )) +
  geom_     () +
  geom_    () +
  theme_     ()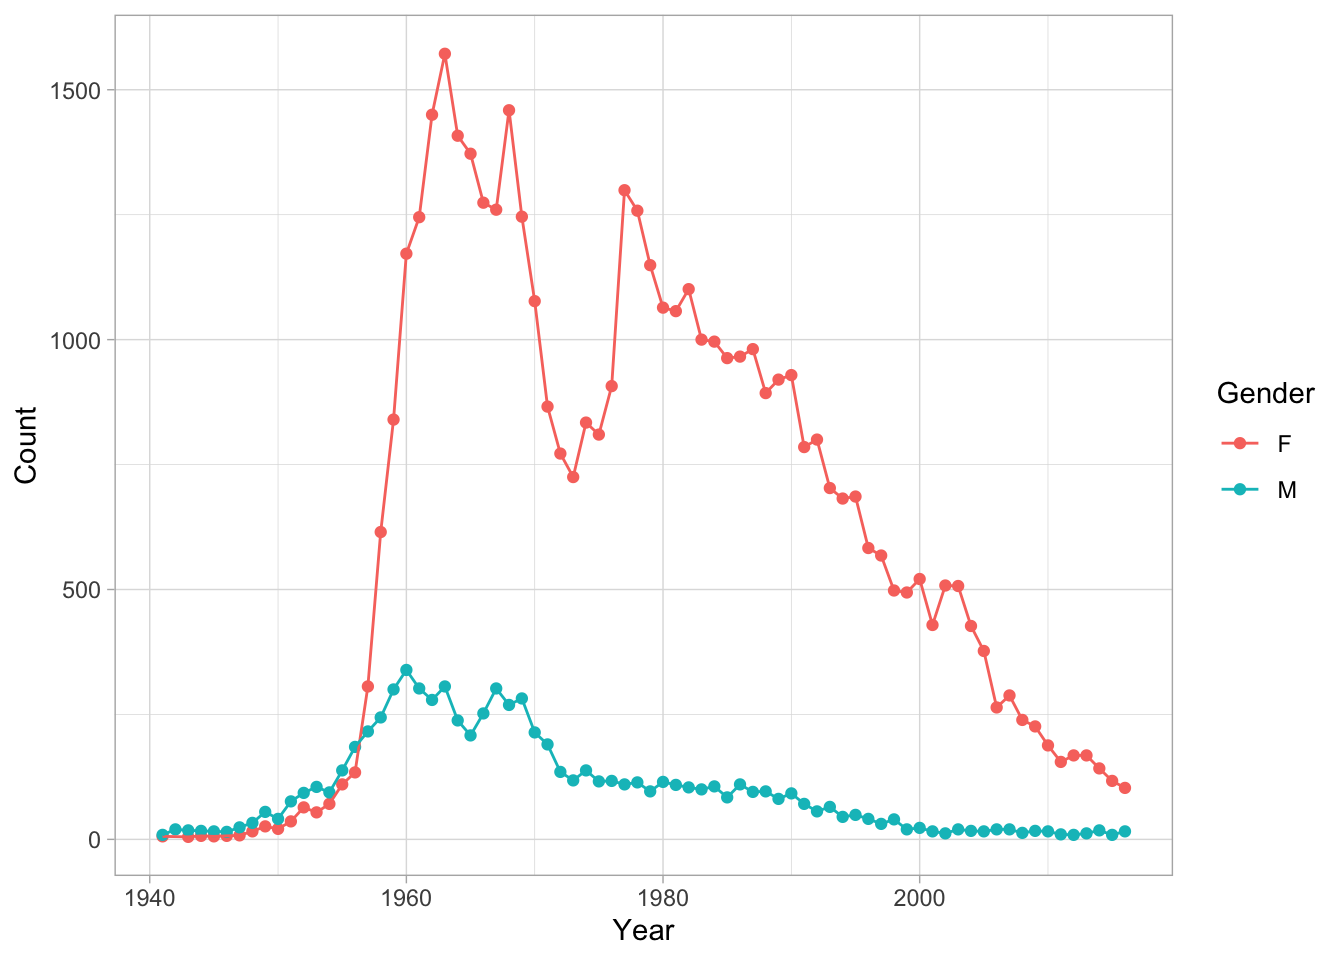
Here I have hidden the flair chunk, so that you can see the exercise as the students do. This is what it looked like:
```{r, echo = FALSE}
decorate("plot") %>%
  flair_rx("ggplot2?", background = "pink") %>%
  mask("Count") %>%
  mask("Year") %>%
  mask("Gender") %>%
  mask("point") %>%
  mask("line") %>%
  mask("light")

```
Students learning to code in R will often quickly figure out how to write code and guess-and-check until the output matches what they wanted. However, it’s also important that they be able to think ahead, and anticipate what each piece of the code will influence in the output.
Fill-in-the blank activities are a great way to practice, and masking with flair makes creating these activities quick and easy!
Wrap-up
You can try out the code in this blog post in this RStudio Cloud project. In general, flair can be used with most R Markdown HTML-based output formats, including slide makers like ioslides and xaringan. It is unfortunately not yet possible to knit to pdf or MS Word files with flair formatting - although we hope to provide that functionality in the future.
If you have any ideas for future flair abilities that would make your teaching and presenting easier, please don’t hesitate to file an issue on GitHub, or to reach out to me personally.
We hope that flair makes your code-presenting process a bit more simple, reproducible, and enjoyable.
Happy flairing!