
Instructors and learners alike have had to quickly adapt to virtual education due to the ongoing pandemic. The learnr package has become a popular tool to ease that transition (see Allison Horst’s great post).
Before our lives were completely changed by the pandemic, however; I was fortunate enough to conduct an introductory R session with a group of teenagers in person. I was able to create the materials for this session, Understanding Injury Data with R, with the learnr package and the source code is available on GitHub. Although in person examples of teaching may not be the most relevant topic under these circumstances, I thought that sharing my experience of teaching a younger audience using learnr could offer a unique perspective.
Some background
I was asked to teach an introductory R session as a part of the Data Science for Women Summer Camp in July 2019. The camp was organized by the Translational Data Analytics Institute at The Ohio State University (OSU). Admission was free and available for young women entering grades 8, 9, or 10 attending local high schools in the metro city area.
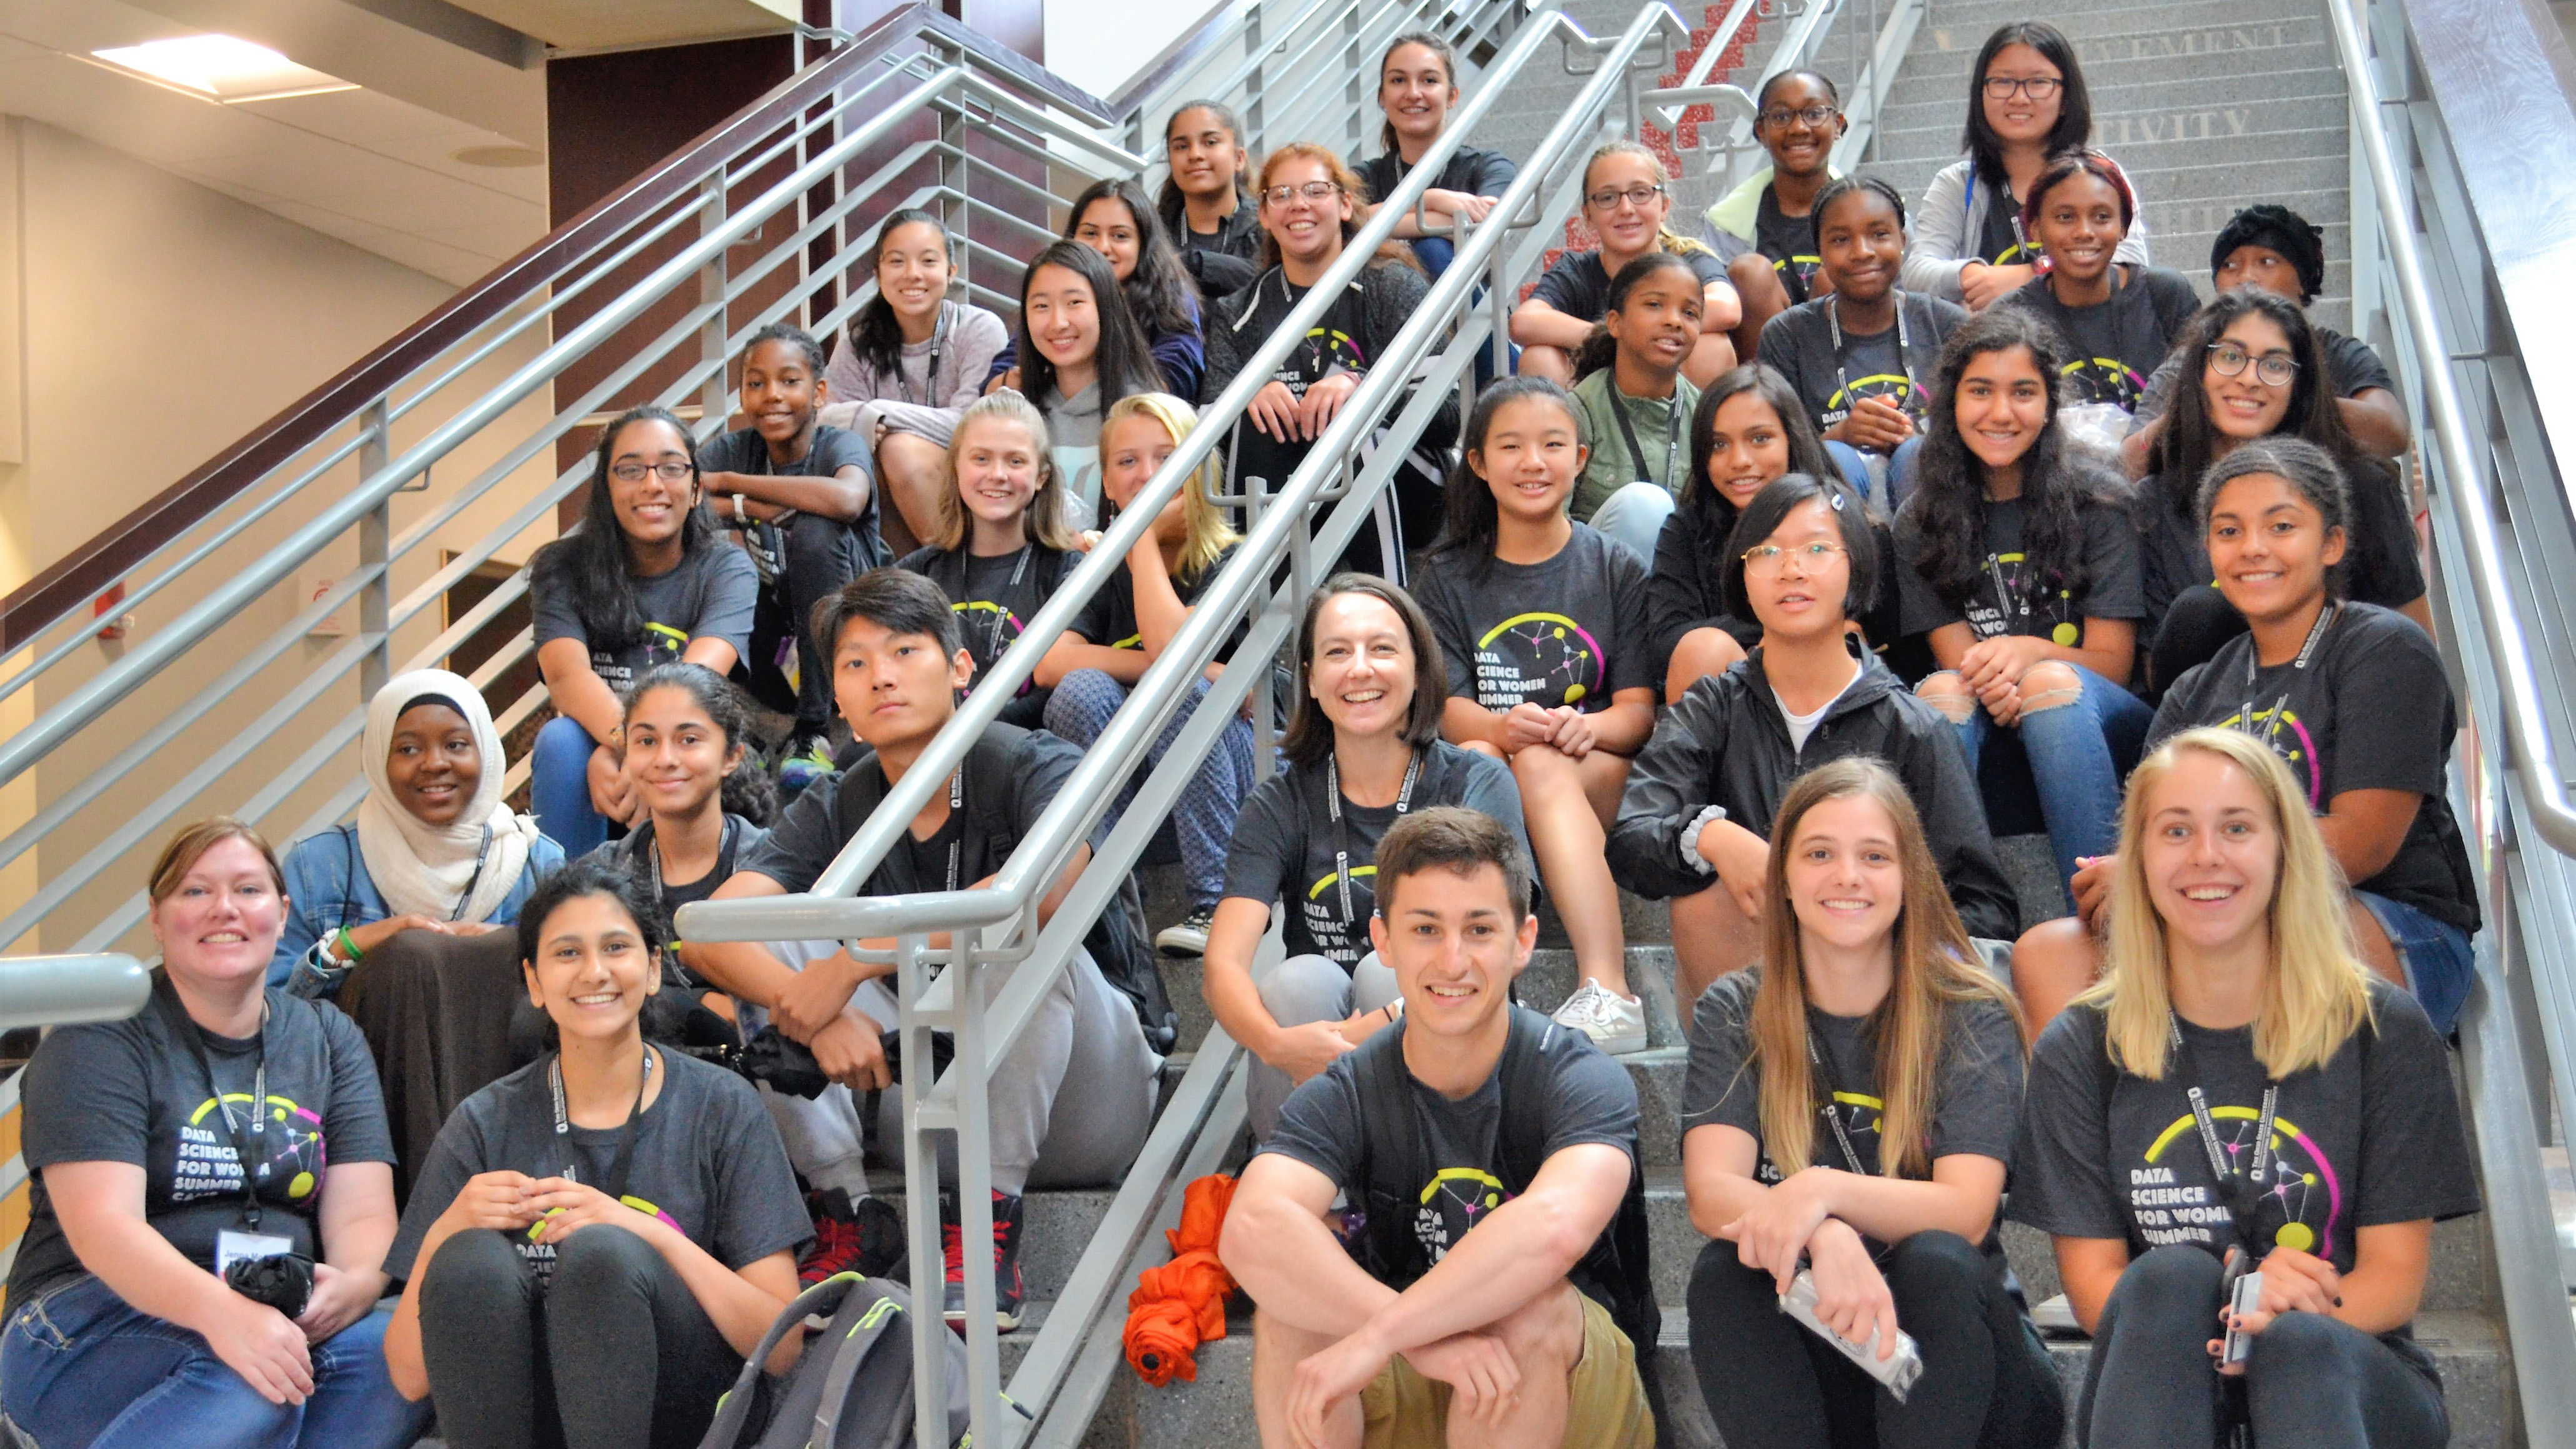
Figure 1: Summer camp group picture with students
At the time I was asked to teach the session, I was still a PhD student at OSU and the co-organizer of R-Ladies Columbus (I am still today). Camp organizers had seen me present several introductory R sessions in local conferences and R-Ladies meetups, and thought I would be a great instructor for the only hands on coding session of the entire data science camp.
Camp organizers asked me to:
- Show how to do data analytics with R
- Expect no statistics background from students
- Use a health related data set
- Do all of this in 50 minutes
Let me assure you, organizers didn’t come to me because they were amazed by my squeaky clean code or my vast R/statistics knowledge. They invited me because they thought I was very enthusiastic, which they believed was the missing ingredient for this session in the past. It turns out, hands-on-coding session wasn’t a favorite among students the year before.
Wake up call
I happily accepted to teach the R session, because I really enjoy teaching R, and thought this short 50 minute session would be easy to figure out and wouldn’t require much work.
Well, I was certainly being naive. While there are many example teaching materials for R, most were designed for college students or other adults, and at the time I couldn’t find any examples for middle- or high-schoolers. Although I came across some amazing K-12 lesson plans to teach statistics on statisticsteacher.org, these weren’t suitable for the short 50 minutes that was allotted for my session. (The wonderful Teacups, Giraffes, & Statistics project didn’t exist back then, but today it would be another wonderful resource to teach R and statistics to a young audience.)
I was also worried about finding a “fun” health data set: talking about diabetes, cancer, or some other complex disease did not sound fun to me at all. Knowing about the unpopularity of the session in the previous year, I was starting to feel quite desperate. I believed my session was going to mirror the bored to death classroom scenes from the infamous Ferris Bueller’s Day Off movie.
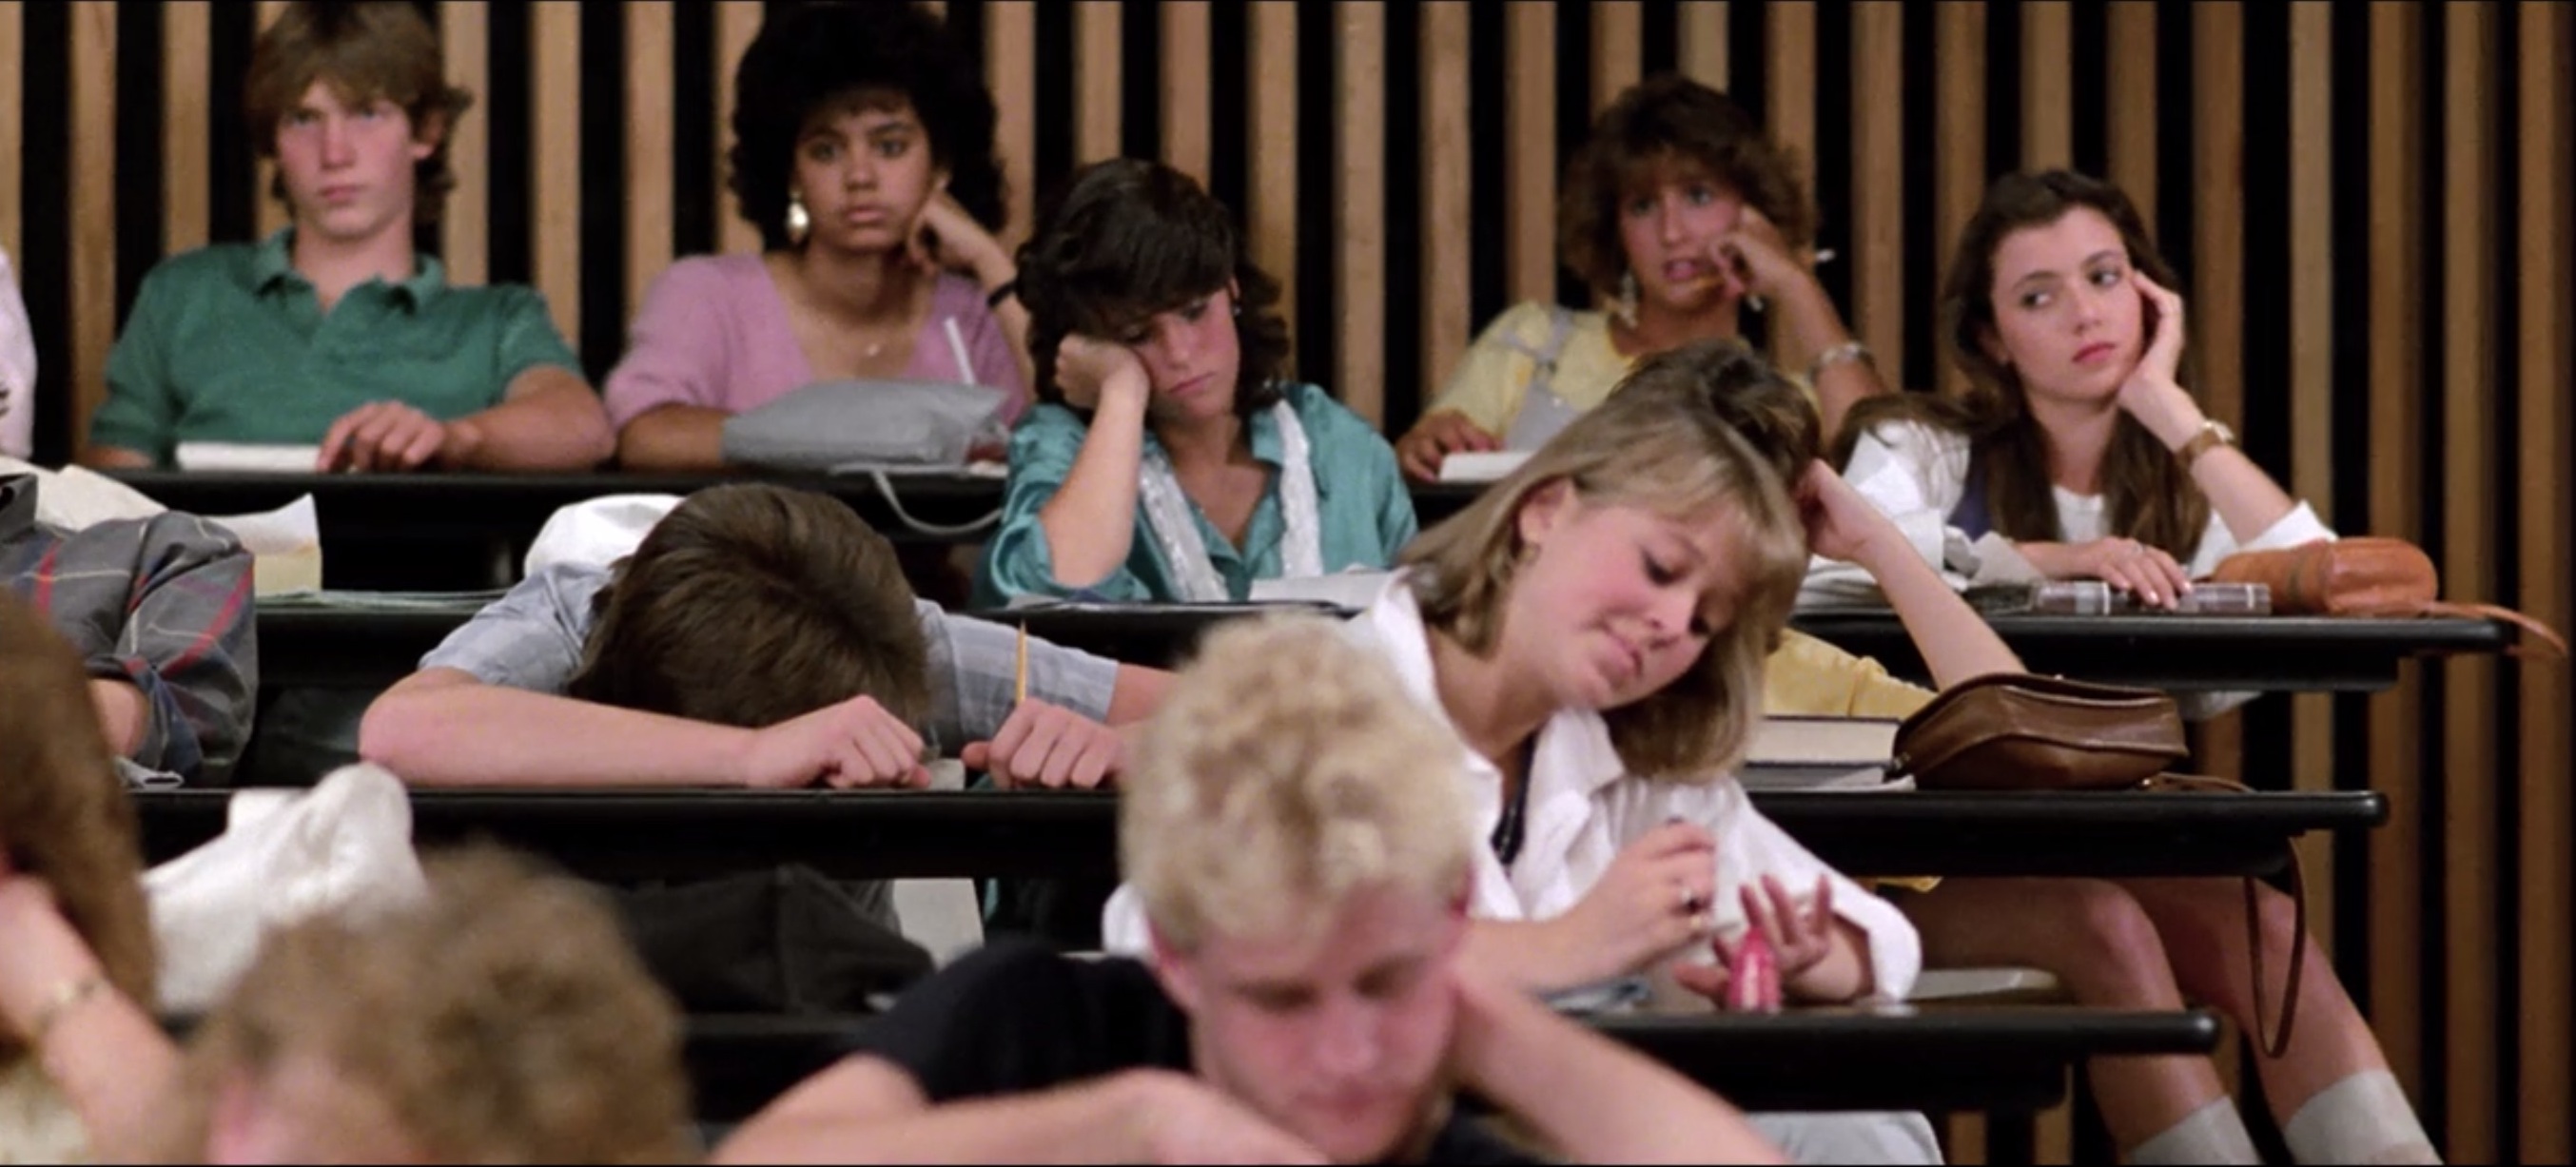
Figure 2: A scene from Ferris Bueller's Day Off movie
Luckily, I attended Kenia Wiedemann’s talk at useR!2019. Kenia is involved with a research project called CodeR4MATH, which aims to integrate R programming in high school math classes. While her curriculum also included multiple sessions throughout the semester, she talked about the amazing learnr package and all the cool things you can do with it. We also got a chance to chat about teaching R to teenagers and here some of the important points I remember:
-
Minimize any unnecessary distraction. Using RStudio Cloud or RStudio IDE in this setting might not be the best choice, as there are too many things you need to clarify before getting to the actual point. This is why learnr is perfect for this setting, you can limit what they can see and do very easily, without making it too rigid or boring.
-
Most teenagers are quite self-involved, you have to find a data set that they can relate to. If you want to get even some of their attention.
-
Do not get discouraged if you don’t feel the enthusiasm and engagement you may feel with adult learners. High schoolers can wear their emotions on their sleeves, and you never know what else they are dealing with. They may be disengaged for any number of reasons, and it isn’t for you to fix or figure out.
I have to admit, at this point I was genuinely terrified and still didn’t know what to talk about. But I knew the tool I had to use: learnr!
And learnr saves the day!
Easy setup
Beyond its pedagogical advantages, learnr is also a clean and easy way to deal with installation or subscription issues that come with dozens of laptops running Windows. In my case, the university was providing all the laptops for the session and it was up to me to set them up. Since we had an internet connection available during the session, I certainly did not want to install R locally and was planning on using RStudio Cloud. That’s great in theory, but then you have to then setup separate RStudio Cloud accounts for each machine, which includes setting up different email accounts as well (which we actually did and ended up with dozens of Gmail accounts 😱).
Thanks to learnr and its easy deployment with shinyapps.io I was able to simply enter the link into the browser for each laptop before the session and they were all ready to go! 🎉
Interactive code chunks
I was also finally happy with my dataset. I decided to use the neiss package, which provides access to the last five years of data (2013-2017) from the National Electronic Injury Surveillance System. The dataset is a sample of all accidents reported to emergency rooms in the US.
Since the session was quite short, my aim wasn’t teaching them how to code in R but let them get a feel of it. I didn’t shy away from putting somewhat complicated code chunks in front of them, and expected them to find and change the arguments correctly to get the answers they needed.
During the session, students talked with their neighbors about physical accidents/injuries they had at home or at school. Then they were able to adjust (fill in) the code in the tutorial with the correct variables/terms to look at the most frequently injured body parts for the overall US population, and their gender and age group in the dataset.
Here’s an example exercise chunk:
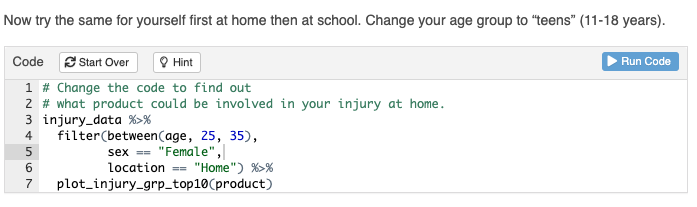
Figure 3: Example code chunk
Hints
I was also able to add hints or solutions to every exercise, so students didn’t get lost and suffer in silence if my instructions weren’t clear. I think the hints were helpful, because although I was in the same room and walking around, I assumed many would be too shy to ask a question.
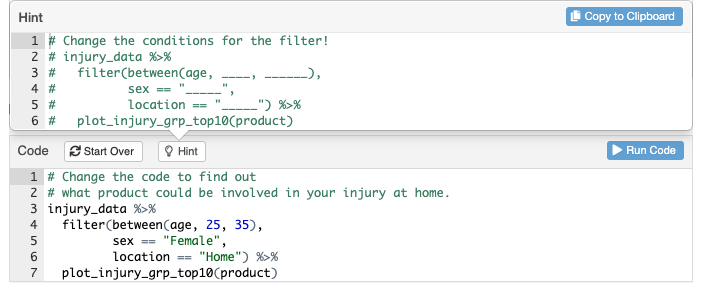
Figure 4: Hint box example
Quizzes
I believe adding quizzes throughout the whole session kept students less distracted and more engaged, as they were busy trying to find the answers.
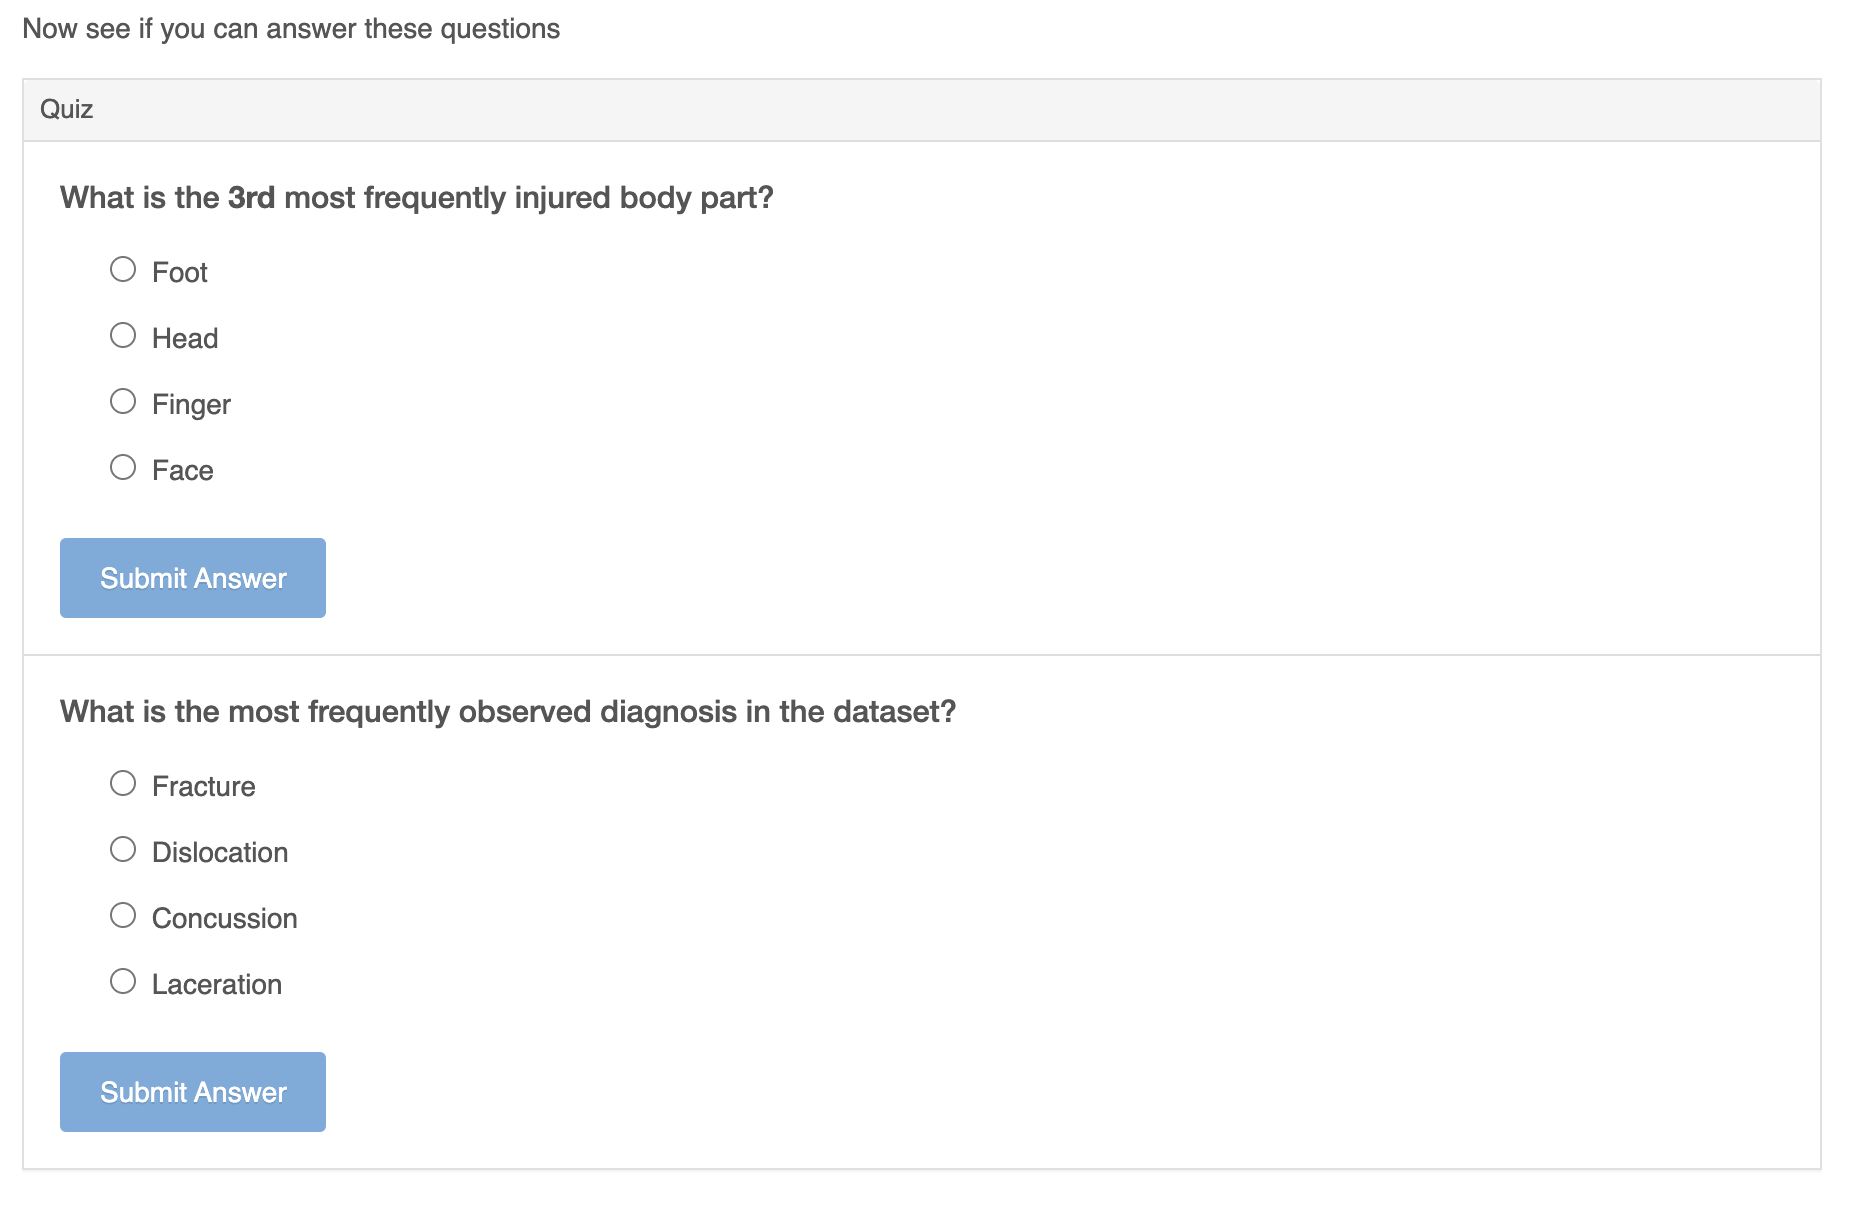
Figure 5: Example quiz from the tutorial
Make it less dry
While default learnr style wasn’t very aesthetically appealing to me, I didn’t have time to explore customization steps before the session. But it is possible to be creative by adding pictures and videos!
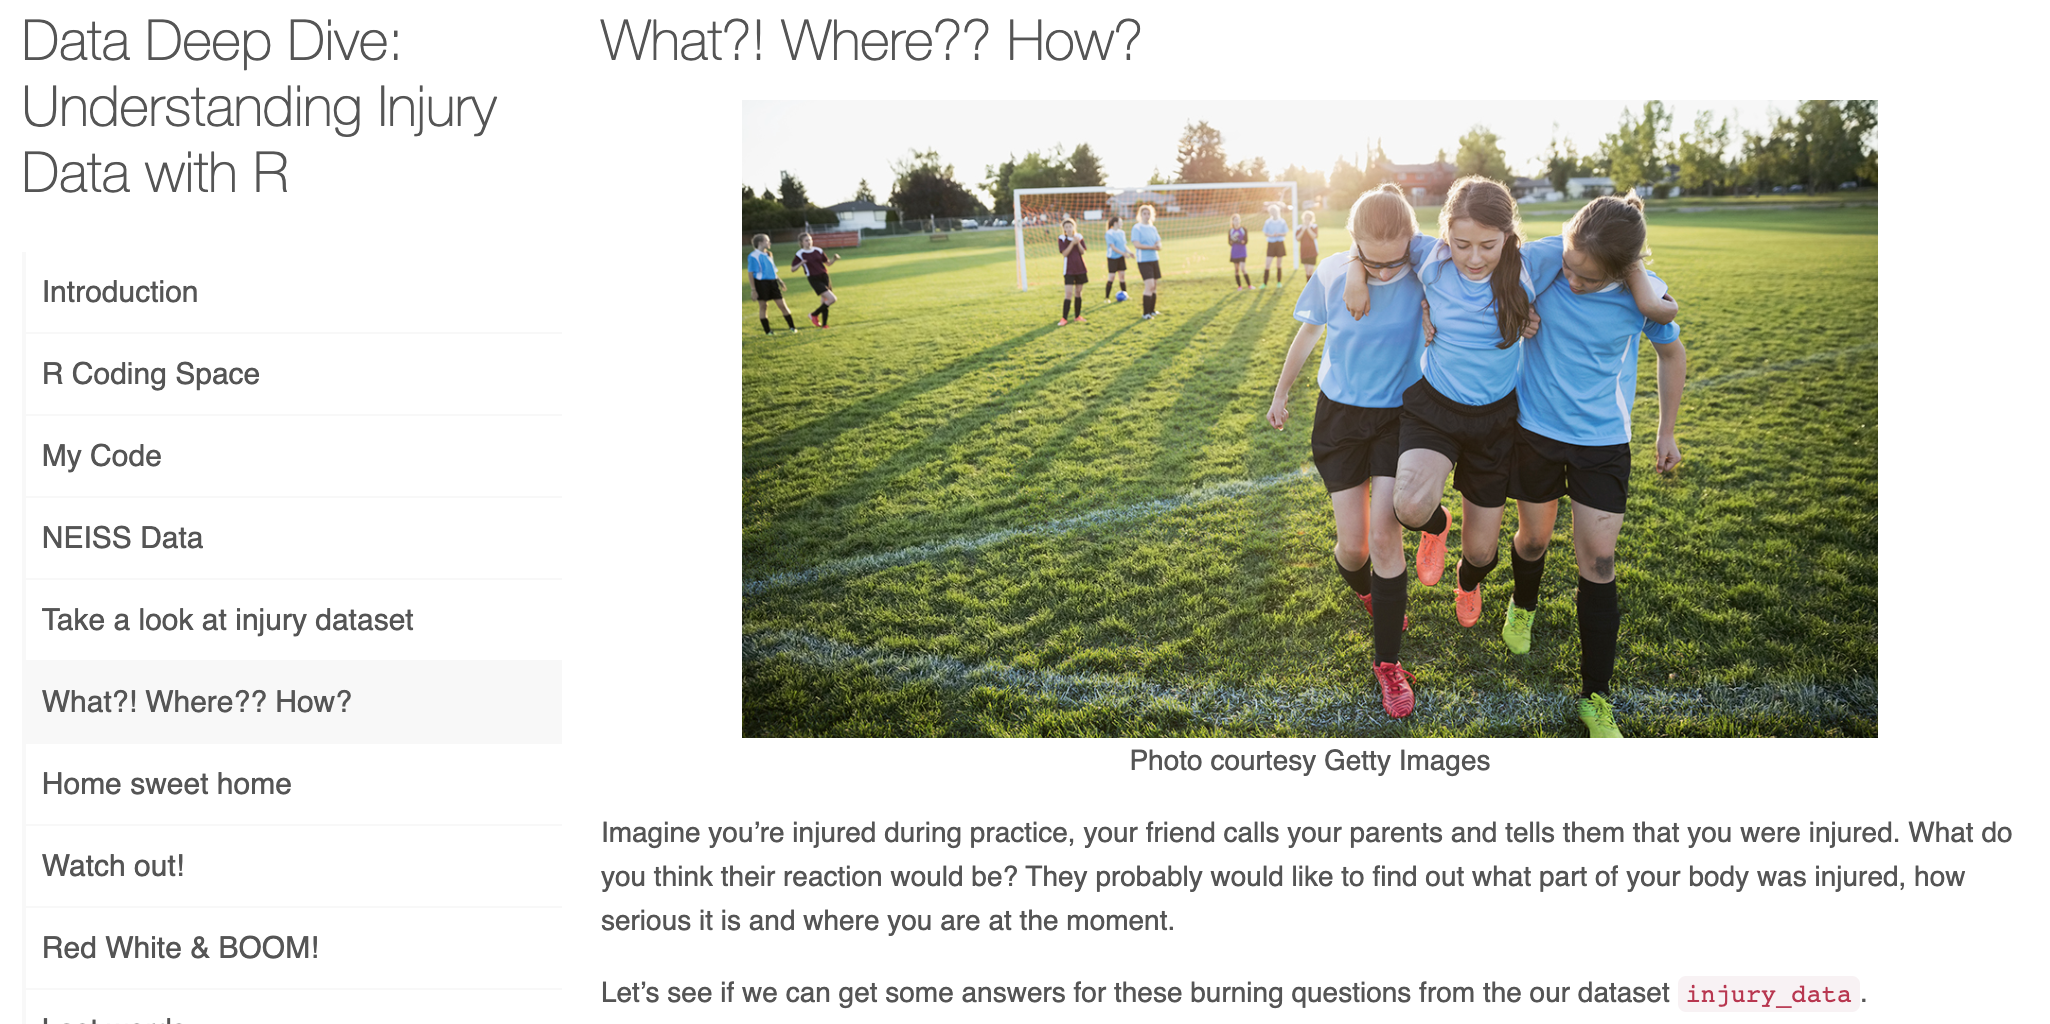
Figure 6: Embedded picture example
And if you would like to go above and beyond, there are many ways to customize it further. Allison Horst’s Exploring missing values in naniar is a shining example of what next level customization can do.
Student feedback
Throughout the session I went through the tutorial on my laptop, which was shared on two large screens for students to see. I walked around regularly to see students’ progress or answer questions. Students talked and laughed about their injuries; some shared their stories with the rest of the class. Overall, I thought the session had good participation, even though it was the first activity of the day (as some students complained about it in their feedback).
I have to add that one student pretty much slept throughout the whole teaching session. She was already in the classroom, sleeping on the table when I got there an hour early to set things up at 8 AM. (I later found out that her parents had dropped her off around 7 AM.) Following the suggestion from before, I didn’t try to wake her up nor did I make a comment about it during the session. I believed she wasn’t sleeping because of my subpar teaching, but due to factors outside of the classroom, which couldn’t be resolved in the 50 minutes that we had.
Naturally, I was very curious to hear what students had to say after the session. Organizers shared the survey data from first two years of the camp: in 2018 same hands-on-coding session was conducted with a pre-written, commented R script by a young professor, and it was conducted with a learnr tutorial by me in 2019. Of course, I had to compare the two sessions:
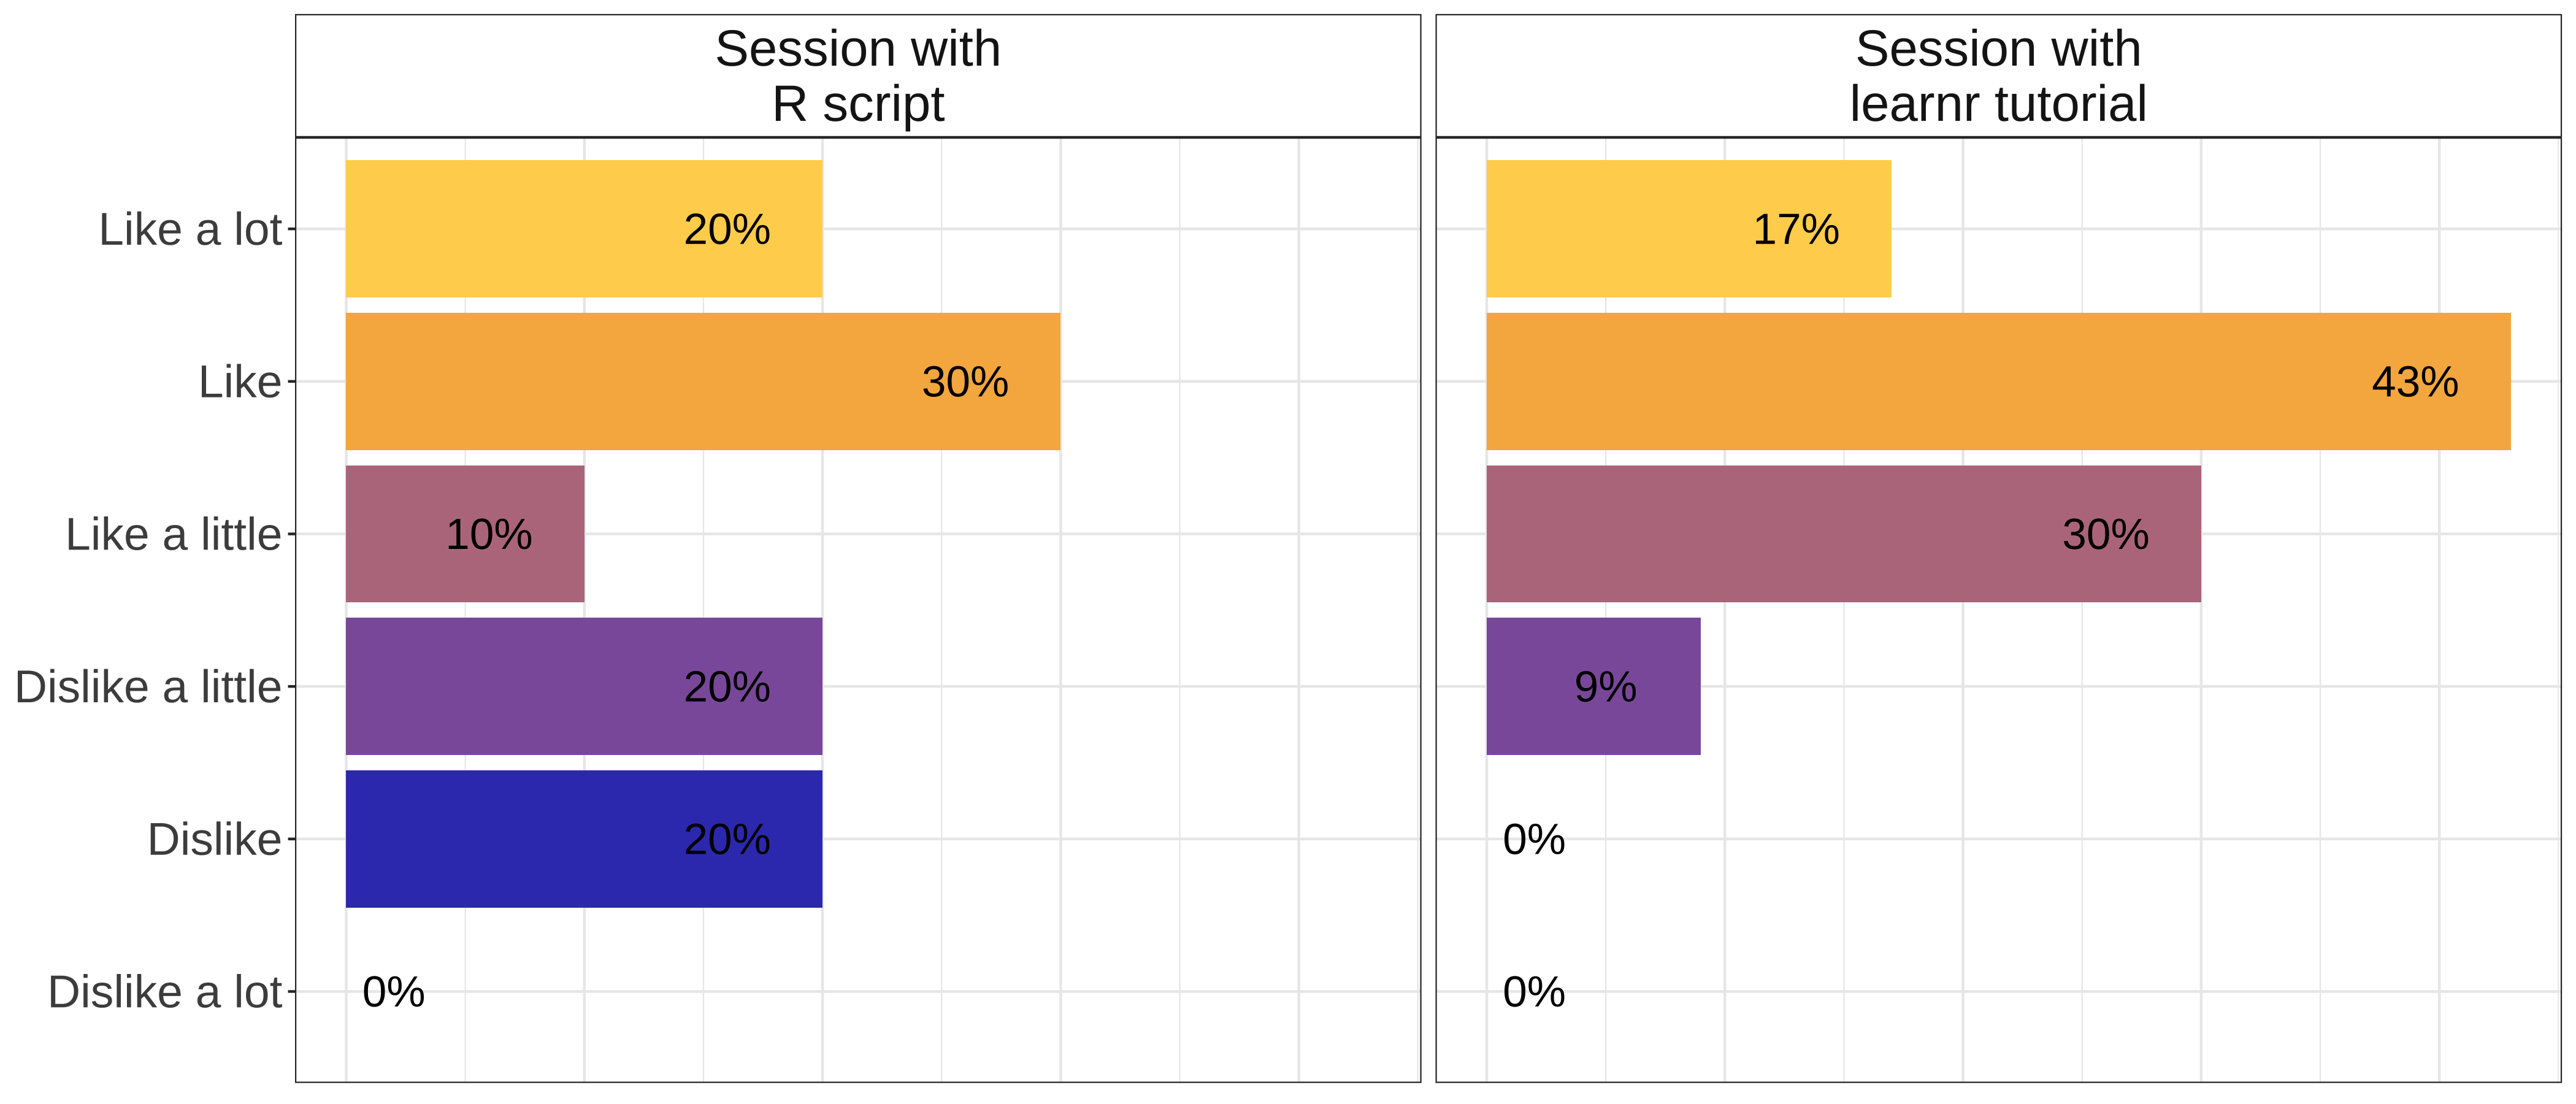
Figure 7: Student feedback shown as bar graph
My hands-on-coding activity wasn’t as popular as other camp activities that involved going to the planetarium or flying drones. 😅 However, I was very happy to see the decrease in the dislikes compared to previous year!
Students were also asked to describe their experience with one word:
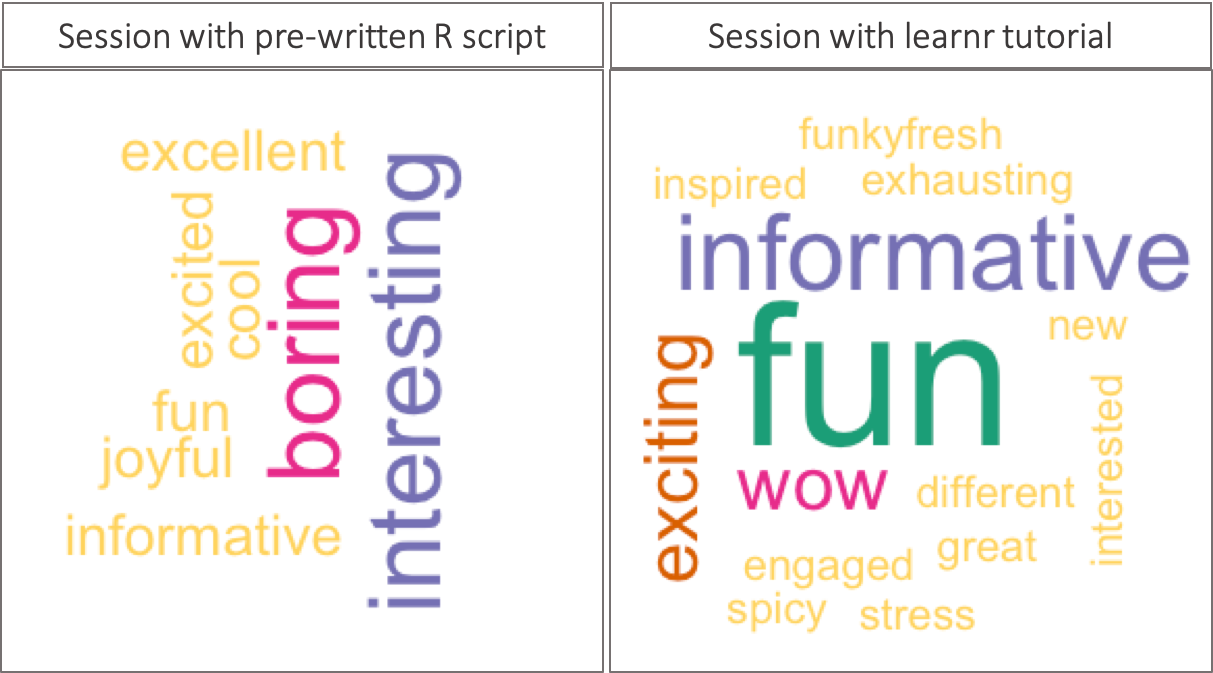
Figure 8: Student feedback in wordcloud
Again it was encouraging to see words like “fun”, “exciting”, and “wow” frequently. (I’m not exactly sure what “funkyfresh” means, but I believe “fresh” is a positive thing?)
The whole point of this summer camp is about encouraging students to select analytical fields in the future. I really hope no student was discouraged of coding because of me! 🙃 I aimed to give them a glimpse of coding, showing that it requires some work but can also still be fun. 🎈
Final words
The learnr package provides a powerful framework that lets students easily interact with the code without begin overwhelmed with errors, warnings, package installations, and all other distractions. Even though learnr is mostly designed for on online self-learning setting in mind, it is highly useful for live sessions where there is limited time to introduce RStudio IDE, or for young audiences that can be easily confused and disengaged with the material. Creating content with learnr certainly takes a little more time and effort than a simple RMarkdown document. It also requires a shinyapp.io account (possibly a paid one for better performance). But in my experience, it was worth all this manageable trouble and saved me from boring students to death! 🦸