
The “official” tidyverse has existed since 2016 but most of its components have a much longer history, for example ggplot2 is the older package and has been around for more than 13 years! The tidyverse continues to evolve and some of the recent updates to tidyverse packages are specifically designed to make it easier for new learners to get started with doing data science in R. Whether you’ve been teaching the tidyverse for years or you’re new to it, it’s useful to periodically catch up with what’s new in the tidyverse.
This week’s theme on the blog is “teaching the tidyverse in 2020” and we will be covering it in four blog posts throughout this week: (1) Getting Started, (2) Data visualisation, (3) Data wrangling and tidying, and (4) When to purrr?
In each of the posts we will highlight recent updates to the tidyverse that educators might want to have on their radar, sprinkled with suggestions for incorporating them into your teaching.
A few housekeeping items before we get started:
-
This series of blog posts, and especially this first one, assumes that you are an educator who is teaching R at the introductory level to students who are new to statistics, data science, R, and/or programming in general. Some of the tips in the upcoming posts will be useful for more advanced courses as well, but this first post post is, well, exactly as its name suggests, is most useful for audiences that are just getting started.
-
For many of the code examples I will use the
penguinsdataset from the awesome palmerpenguins package. So let’s go ahead and load it.
# devtools::install_github("allisonhorst/palmerpenguins")
library(palmerpenguins)
Let’s get started!
So, what is the tidyverse?
The tidyverse is an opinionated collection of R packages designed for data science. All packages share an underlying design philosophy, grammar, and data structures. [Source]
If you’re a tidyverse user and/or an avid reader of this blog, you probably already know this. But how about your students? Do these words mean anything to your students the first time they hear them? How do you introduce your students to the tidyverse, especially if they are also new to R?
Start with the core packages
Start with the core packages, by briefly stating the primary purpose of each, in the order that students will encounter them in your course, e.g.
- ggplot2: data visualisation
- dplyr: data wrangling
- readr: reading data
- tibble: modern data frames
- stringr: string manipulation
- forcats: dealing with factors
- tidyr: data tidying
- purrr: functional programming
This is the order I recommend and the order that follows the curriculum outlined in Data Science in a Box. Start with visualisation (ggplot2) and delay introducing functional programming (purrr) until later. (More on why and how to delay introducing purrr in the last post in the series!)
I like introducing the tidyverse with a visual showcasing the pretty hex logos. I cannot say that this necessarily adds to student learning, but it sure draws students in!
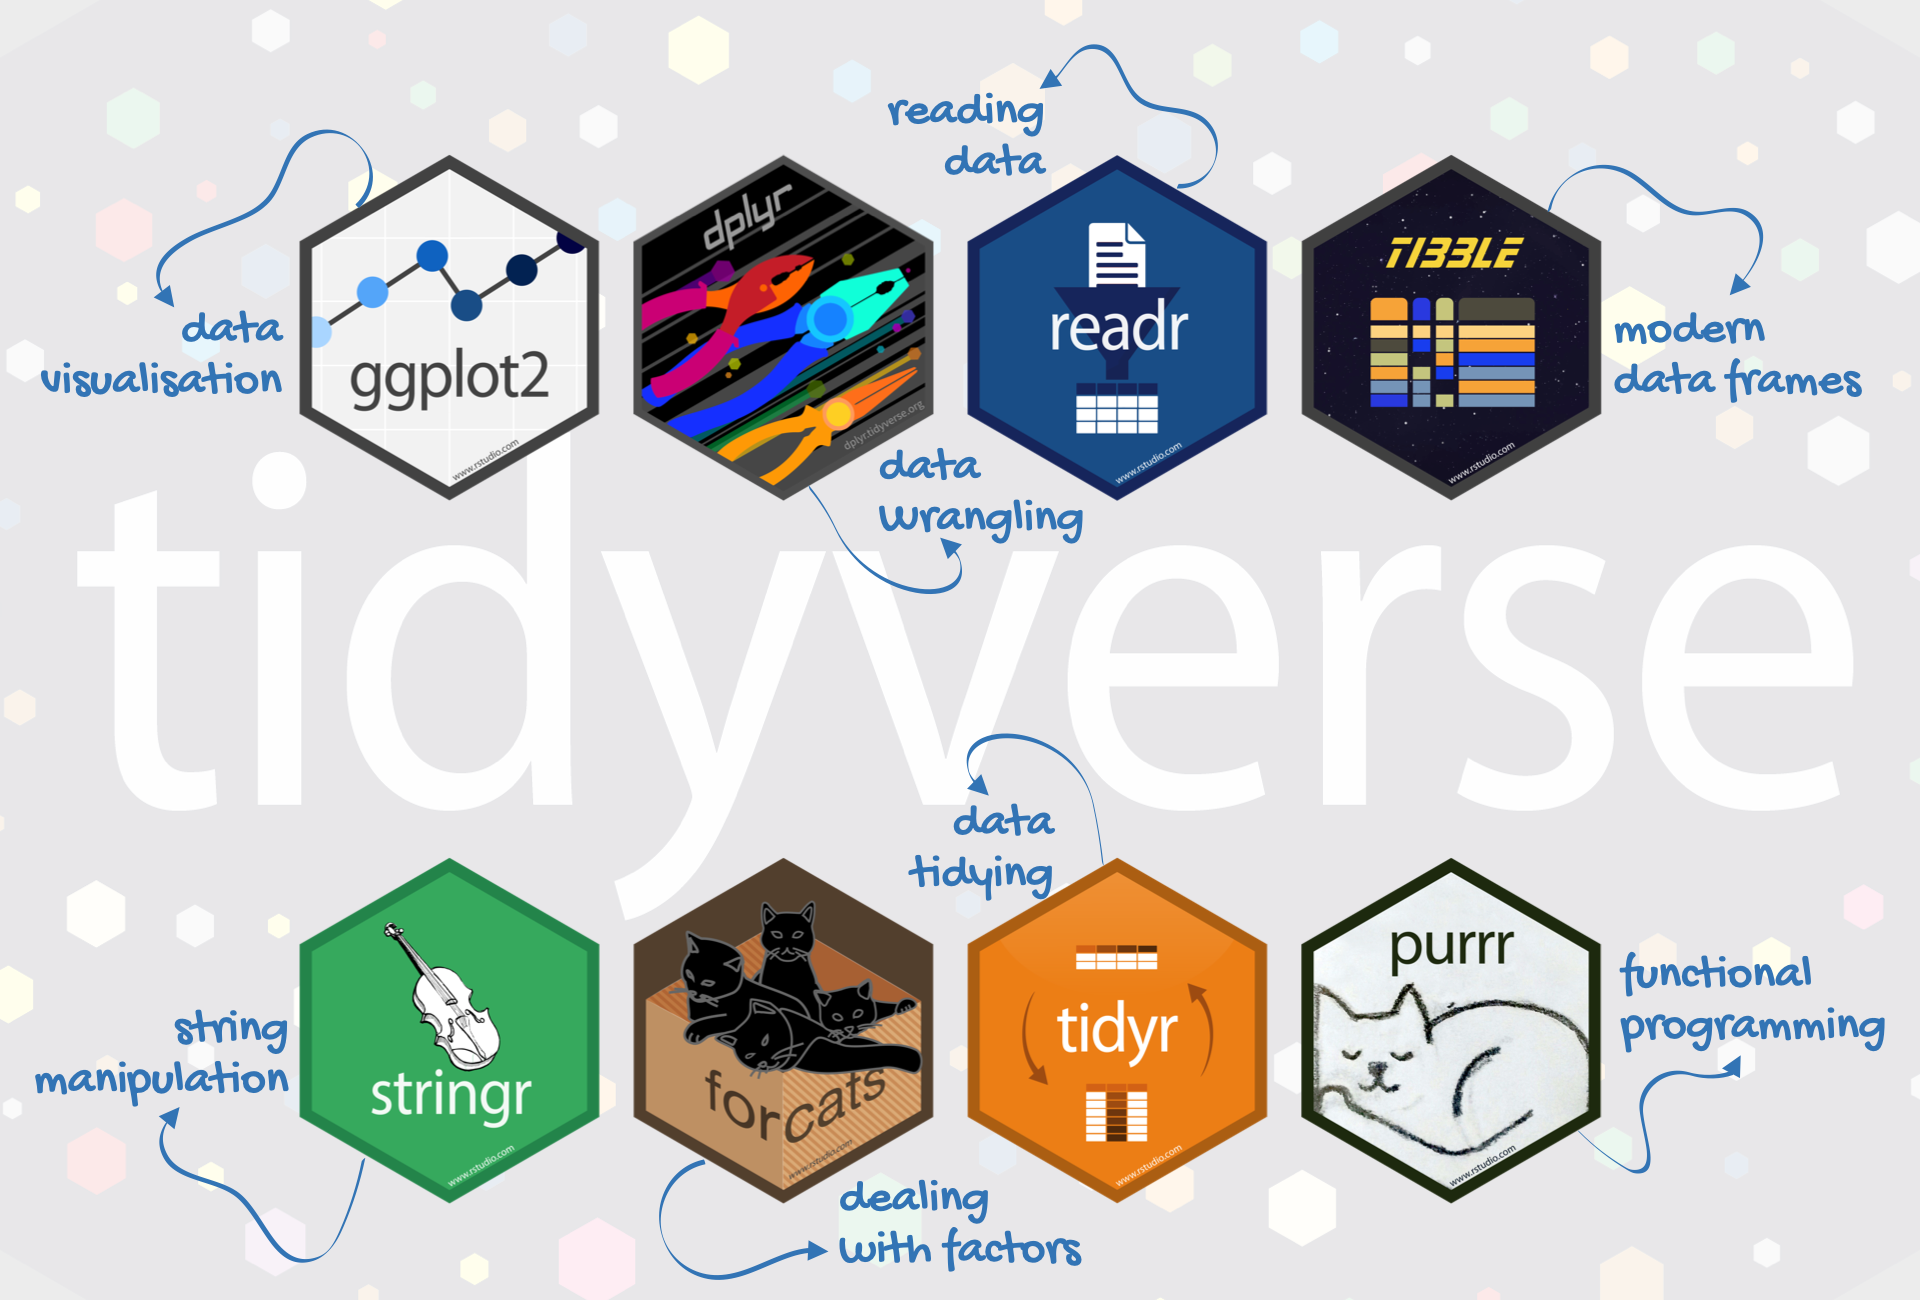
Figure 1: Hex logos for the eight core tidyverse packages and their primary purposes.
The important thing to note here is that I don’t recommend bringing up the non-core packages, i.e. those installed with the tidyverse, but not loaded along with it. Regardless of the level at which you’re teaching, chances are you won’t be using all of those packages in a single course. I recommend introducing other packages used in your course (whether they are a part of the tidyverse or not) as they become relevant to the topic you’re covering, and simply highlight that the packages from the wider tidyverse share the design philosophy, grammar, and data structures as the core packages, e.g. the rvest package for web scraping plays nicely with pipes.
Use library(tidyverse)
Load all packages with library(tidyverse) instead of loading the core packages individually.
This is especially useful if you are taking the
“let them eat cake first” approach and presenting interesting and complex examples on day one of the course.
It also means that your students need to only remember the name of one package, as opposed to multiple packages.
You would, of course, want to mention the names of individual packages that make up the tidyverse as you teach specific topics that are best solved with those packages (e.g. provide a proper introduction to ggplot2 when teaching data visualisation and to stringr when teaching string manipulation) but library(tidyverse) will allow you to harness all that the tidyverse has to offer at once, without having to provide a lengthy introduction to each package on the first day of class.
A useful side-effect of this is that you get access to the
few functions in the tidyverse meta package.
The tidyverse_sitrep() function (which gives a situation report on the tidyverse packages, i.e. a list of all installed tidyverse packages and their versions) and the tidyverse_update() function (which updates all tidyverse packages) can be useful when debugging code, especially if a student is getting output that looks different than yours after running the same lines of code.
Review the package loading message
When you load the tidyverse package, it prints out the following message:
library(tidyverse)
## ── Attaching packages ──────────────────────────────────────── tidyverse 1.3.0 ──
## ✓ ggplot2 3.3.2     ✓ purrr   0.3.4
## ✓ tibble  3.0.3     ✓ dplyr   1.0.0
## ✓ tidyr   1.1.0     ✓ stringr 1.4.0
## ✓ readr   1.3.1     ✓ forcats 0.5.0
## ── Conflicts ─────────────────────────────────────────── tidyverse_conflicts() ──
## x dplyr::filter() masks stats::filter()
## x dplyr::lag()    masks stats::lag()
I recommend explicitly addressing this message in your teaching.
I think this is the hardest step of them all, because really understanding some of this requires understanding package versions, name spaces, and the :: operator, none of which are things I like to get into in the first 10 minutes of a class.
At the same time, ignoring messages/warnings/errors is also not a habit I like to model.
My suggestion is to
- suppress package loading messages on the first day activity, which is straightforward if students start off with a template R Markdown document that you prepared, where the chunk where you load tidyverse has
message = FALSEset, and then - starting on the second module/day of class go through what the message means in full, with assurances to students that they don’t need to “worry” about it, but it’s worth for them to see it.
A good point in the class to come back to this message is when introducing dplyr::filter(), which tends to be early on in an introductory data science or statistics course.
You can run the filter() command without loading the tidyverse package and ask students to guess what the error means.
For example, let’s try to filter for penguins whose species is Chinstrap, without loading the tidyverse. And assume for a second that you are running the following code in a fresh R session, prior to loading the tidyverse package.
penguins %>%
  filter(species == "Chinstrap")
## Error in filter(., species == "Chinstrap"): object 'species' not found
The error is confusing because we know there is a variable called species in the penguins dataset.
If you have already reviewed the tidyverse package loading message earlier in your class, you can now ask students to guess why they might be getting this error. This is a good opportunity to review the message and also an opportunity to clarify why it’s OK to not worry about the message if what you want to do is to use functions from the tidyverse.
Now, let’s try again, this time with the tidyverse package loaded.
library(tidyverse)
penguins %>%
  filter(species == "Chinstrap")
## # A tibble: 68 x 7
##    species island bill_length_mm bill_depth_mm flipper_length_… body_mass_g
##    <fct>   <fct>           <dbl>         <dbl>            <int>       <int>
##  1 Chinst… Dream            46.5          17.9              192        3500
##  2 Chinst… Dream            50            19.5              196        3900
##  3 Chinst… Dream            51.3          19.2              193        3650
##  4 Chinst… Dream            45.4          18.7              188        3525
##  5 Chinst… Dream            52.7          19.8              197        3725
##  6 Chinst… Dream            45.2          17.8              198        3950
##  7 Chinst… Dream            46.1          18.2              178        3250
##  8 Chinst… Dream            51.3          18.2              197        3750
##  9 Chinst… Dream            46            18.9              195        4150
## 10 Chinst… Dream            51.3          19.9              198        3700
## # … with 58 more rows, and 1 more variable: sex <fct>
Et voilà! This is looking much better.
Help them get help
Anatomy of R help docs
R comes with built in help documents. And they tend to be pretty thorough. But they are not always easy to digest, especially if you haven’t seen them before. Kieran Healy has a very nice example of an annotated R help page. I strongly recommend showing this, or better yet, a similarly annotated page for the first help document that you show in your class. It is also useful to tell students not just what’s on the help document, but how to read it. Many R help documents have a lot of technical information between the description and the examples, and usually it’s best to look at those two sections first, before diving deeper into the rest of the documentation. Skipping sections and scrolling to the bottom of the document won’t come naturally to your students, it’s a behaviour you want to model and narrate a few times, early on in your course.
Walkthrough of package pages
Each tidyverse package has a website at [PKGNAME].tidyverse.org (e.g.
dplyr.tidyverse.org,
ggplot2.tidyverse.org).
The functions in each package are in the Reference tab, and this is worth pointing out to new learners.
It is also worth pointing out that while the content of the function documentation on package websites mirrors the content in the help documents you can get in R with ?function, the package website shows the output of the code in the examples.
It can be a lot more efficient (and pleasant) to browse the documentation pages on the web, especially for plotting functions where documentation clearly shows which function you need to use to get your plot to look a certain way.
Googling for help
Googling how to do something is obvious, but it’s not always obvious how best to Google for help. Appending the search phrase with “tidyverse” is almost always helpful for tidyverse specific help, but not always obvious to new learners.
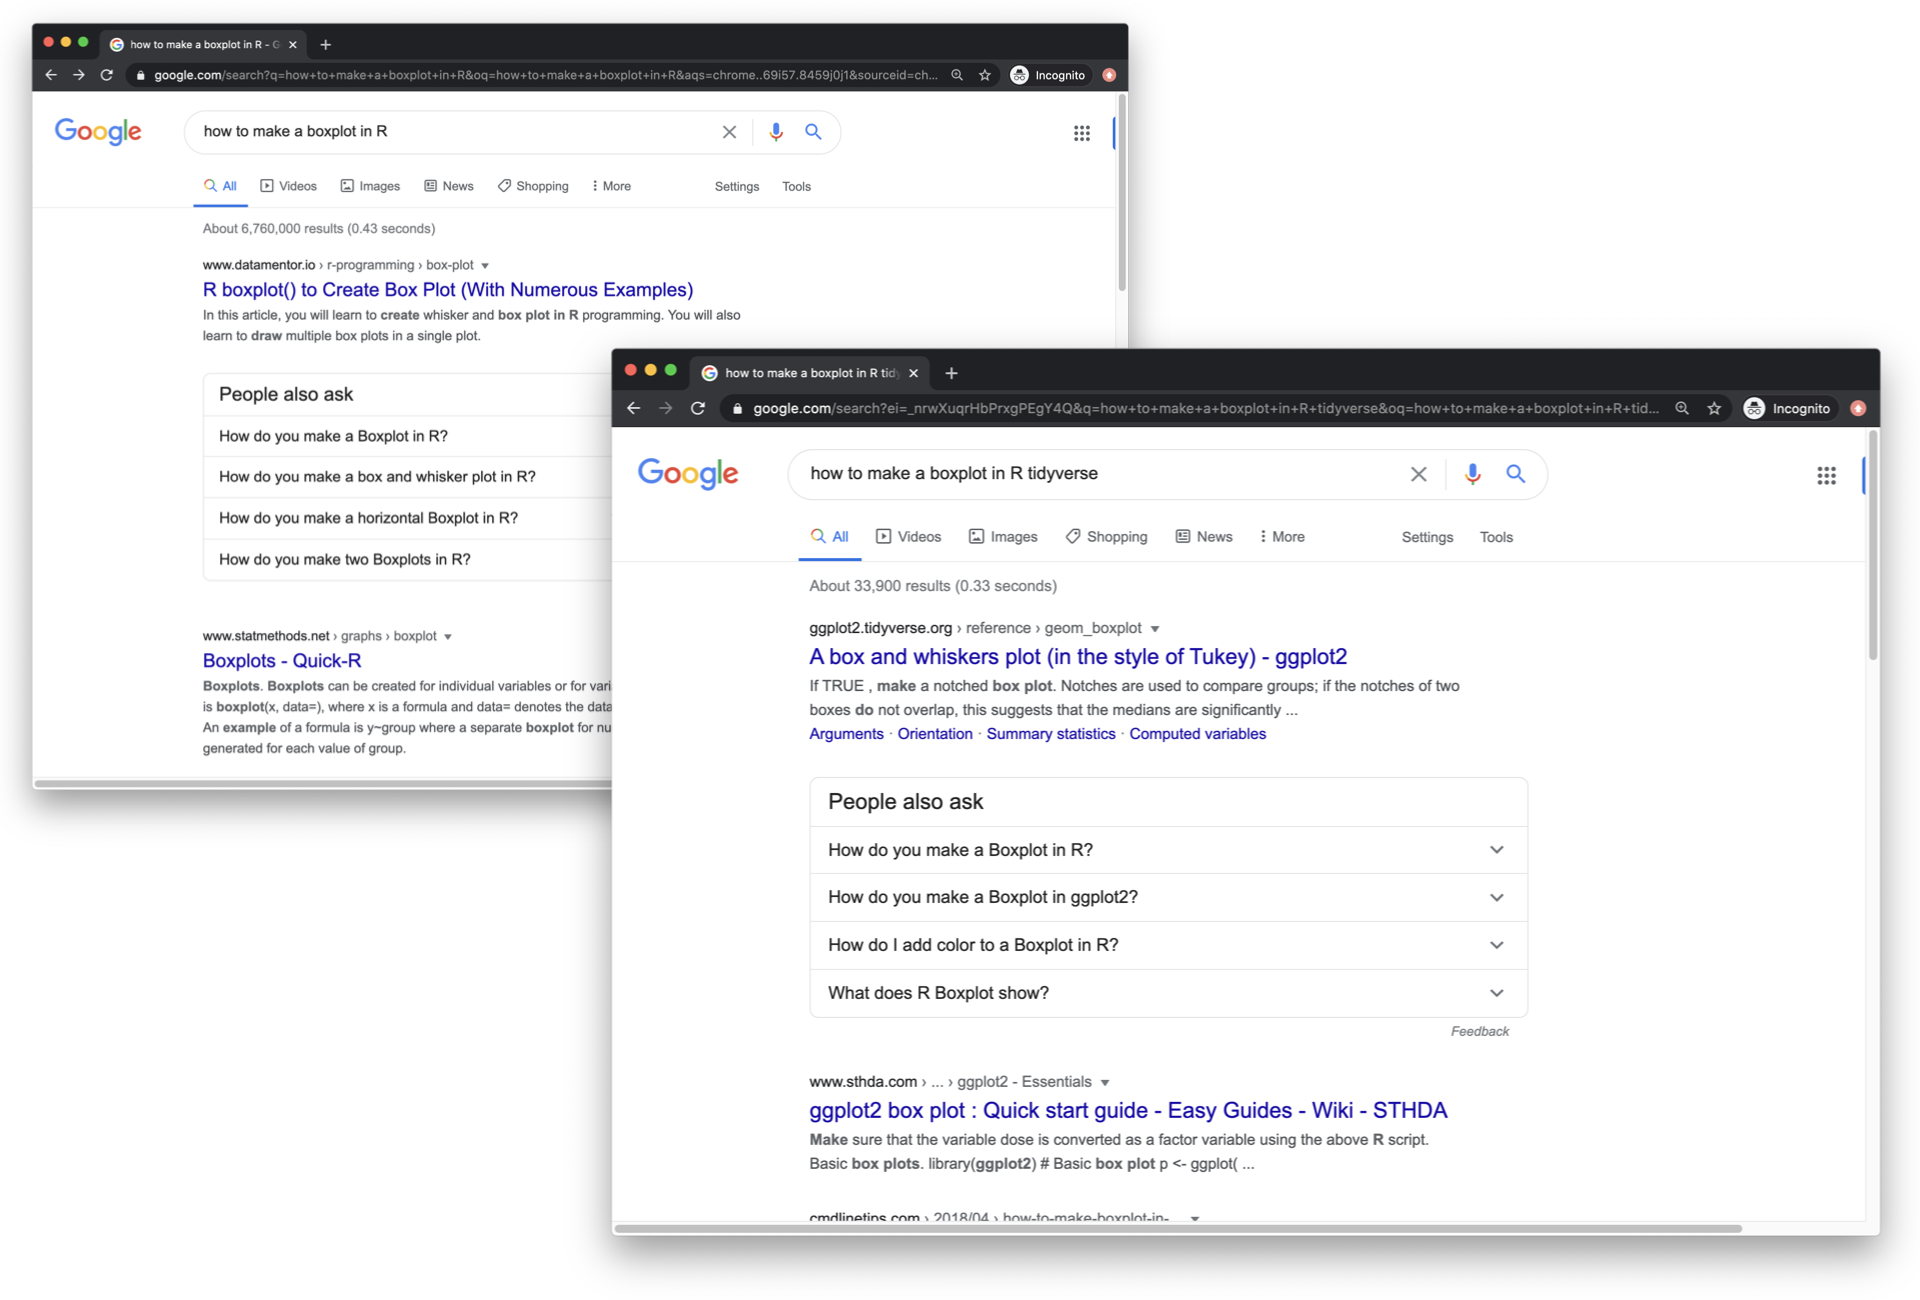
Figure 2: Search results for 'how to make a boxplot in R' with and without 'tidyverse' appended to the search phrase.
Make time for reprex
What is a reprex? It’s a reproducible example, as coined by Romain Francois. It’s also the name of the package that creates runnable code and output based on R code on the clipboard. Teaching your students how to make reprexes will have an immense payoff for them (and for you, as you try to help them). However making repexes is not trivial for beginners. It’s especially not easy for students learning R starting with an R markdown document as opposed to an R script. This means you should make time in class to teach how to make a reprex, through live coding demos (or narrated screencasts) a few times. If you use an online discussion forum for questions (or if your students email their questions to you), you might need to coach them through making reprexes the first few times they try. Learning how to make a reprex will empower your students to ask good questions, or better yet, help them answer their own questions as they develop the reprex.
Provide background
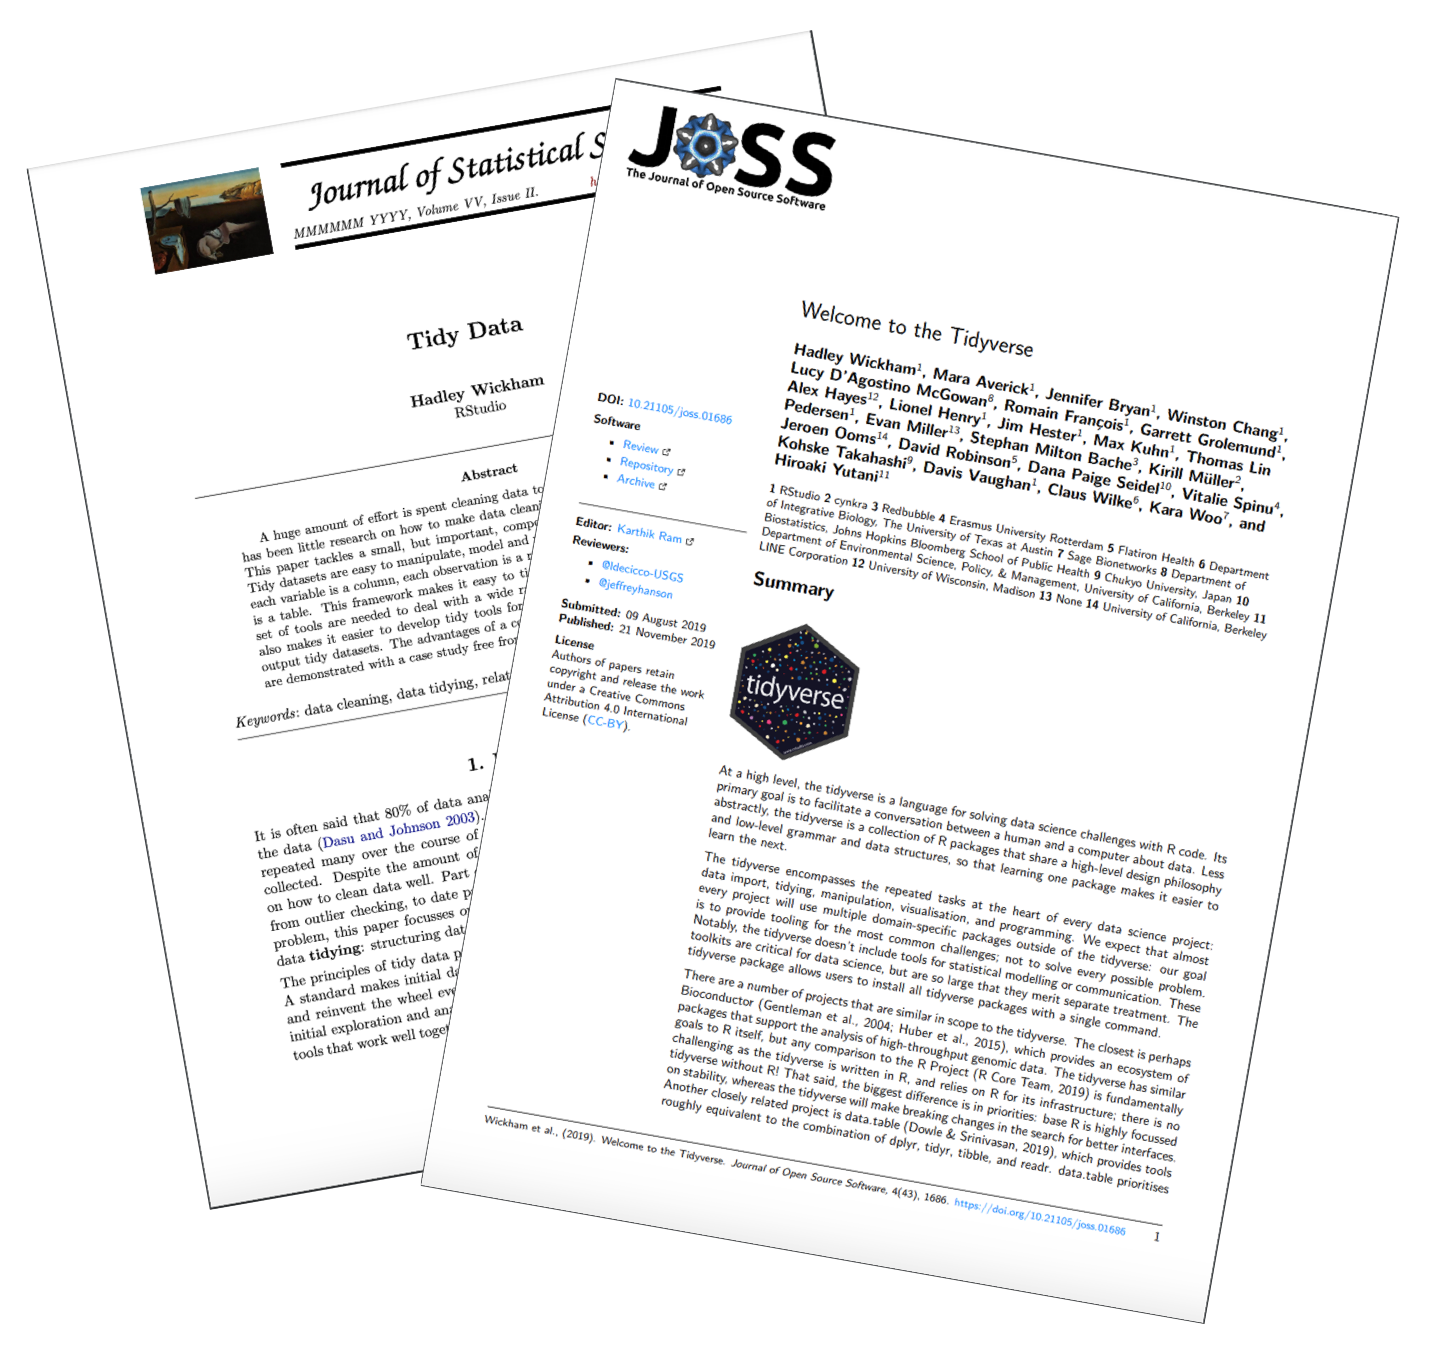
I strongly recommend assigning (or at least suggesting) the following papers as reading early on in your course.
- Wickham, Hadley, et al. “Welcome to the Tidyverse." Journal of Open Source Software 4.43 (2019): 1686.
- Wickham, Hadley. “Tidy data." Journal of Statistical Software 59.10 (2014): 1-23.
These papers give insight into the underlying scholarship and the intellectual history underpinning these tools and their development. The first paper (Welcome to the Tidyverse) can be assigned at the beginning of the course, as you introduce the tidyverse. I would recommend holding off on assigning the second paper (Tidy data) until you introduce the not just the concept of tidy data but also tools for tidying data (i.e. functions from the tidyr package).