
Since RStudio’s instructor training program launched last year, more than 65 people have completed the exams needed to become certified. We hope these sample exams will give prospective trainers an idea of what we’re looking for; as always, we would be grateful for feedback from the community.
Teaching Exam
- The exam covers material from the one-day instructor training course, and we’re happy to answer questions about scope.
- You must complete within 90 minutes.
- You may use any books or online resources you want during this examination, but may not communicate with any person other than your examiner, and may not share information with other people about the content of this examination.
Instructions for Sample Lesson
Prepare a 15-minute lesson on a topic related to R, RStudio products, or data science and submit it to the examiner at least two days before your scheduled examination. Your submission should include (but is not restricted to):
- A learner persona characterizing the audience for the lesson.
- A concept map showing the mental model you intend to convey.
- Two formative assessments (such as multiple choice questions or Parsons Problems).
- Any notebooks or slides you would use to support delivery of the lesson.
You will have 15 minutes during the examination to deliver the lesson and its formative assessments.
- Live coding is strongly encouraged; if you make any mistakes (deliberate or otherwise), try to incorporate them into your teaching as you would in front of a class.
- Your examiner will (try to) work through one of your formative assessments during the lesson. Please allow 3–5 minutes for this in your planning.
Question 1
Present the demonstration lesson you have developed for this examination.
Question 2
Elements of data structures in R can be indexed using single square brackets thing[index], double square brackets thing[[index]], or dollar signs thing$index. You are teaching an introductory workshop on R, and have just given examples of all three kinds of indexing.
-
Create a multiple choice question to test their understanding. Include one right answer and at least two wrong answers, and explain clearly what misconceptions the wrong answers are intended to diagnose.
-
Create a short fill-in-the-blanks coding exercise to test their ability to use all three kinds of indexing correctly. Provide the explanatory text you would give the learners and the template code they would fill in, and explain what answers you expect and what errors you expect learners to make.
Question 3
To support a just-in-time online training course (i.e., a MOOC) for people who are already competent programmers and are learning their way around the tidyverse, your colleague has created a set of programming challenges and written a dozen unit tests to go with each one. When the learner submits a solution, the system runs all of the unit tests and tells the learner how many passed and failed. The learner does not get to see the tests themselves: all they get back each time they submit is a score like “6/12”.
- What are two strengths of this approach from a learner’s point of view?
- What are two weaknesses from a learner’s point of view?
- What are two strengths from a teacher’s point of view?
- What are two weaknesses from a teacher’s point of view?
When answering, please connect your points to specific aspects of educational or pedagogical theory where you can.
Question 4
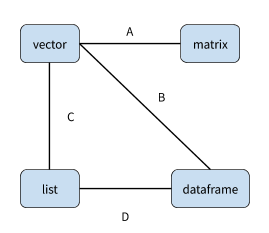
R has several structured data types, including vectors, lists, matrices, and data frames.
- What labels would you add to the concept map below to explain their relationship?
- What are two other concepts you would add to this concept map, and how would they relate to each other and to the existing concepts?
Question 5
A senior professor in your department wants to give this question to an undergraduate statistics class to prompt discussion of bias:
People of East Asian or South Asian ancestry make up 8% of the Canadian population, but 60–75% of undergraduates in Computer Science at major Canadian universities.
- Write two one-page papers to argue pro and con that this proves people of European descent are intrinsically less capable of abstract reasoning than their Asian counterparts.
- Compare and contrast your arguments with those made about the underrepresentation of women in computing and data science being due to aptitude and/or interest.
In one or two sentences each, explain two pros and two cons of using this exercise with this audience as if you were giving your colleague feedback. (Note: you are not expected to answer the question above, but rather to give your senior colleague feedback on it.)
Question 6
Watch the video embedded below and list feedback you would give the presenter about what they’re doing well and what they could improve.
[link varies from exam to exam]
| Content | Presentation | |
|---|---|---|
| | | Positive |
| | | Negative |
Tidyverse Certification Exam
- This exam covers material from R for Data Science (https://r4ds.had.co.nz/). If you have any questions about scope, please get in touch - we’d be happy to clarify.
- You may use any books or online resources you want during this examination, but you may not communicate with any person other than your examiner.
- You are required to use the RStudio IDE for this exam. You may use either the desktop edition or rstudio.cloud as you prefer.
- You may do your work in an R script or an R Markdown file, and may use one for the whole exam or one for each question as your prefer. Whichever you choose, you must send your final work to the examiner by email upon completion of the examination.
- Please let the examiner know when you finish each part of each question so that they can check your work.
August 2020: Marly Gotti has created a solution guide for this exam.
Question 1
The file
at_health_facilities.csv contains a tidy dataset with four columns:
- The ISO3 code of the country that reported data.
- The year for which data was reported.
- The percentage of HIV-positive children born to HIV-positive mothers age 15–17.
- The percentage of HIV-positive children born to HIV-positive mothers age 20–34.
Please answer the following questions:
- How many countries reported data?
- What is the difference between the minimum and maximum year with valid data for each country?
- How many countries reported data in 3 or more years?
- Which countries reported 100% incidence for at least one year in either age group?
Question 2
A student has sent you the file
rmd-country-profile.Rmd, which is an R Markdown document analyzing the data in
at_health_facilities.csv for Bangladesh. They could not knit the file, and are providing you with the raw .Rmd file instead of a rendered file.
- Go through the file, fixing things that are preventing it from knitting cleanly.
- Change the two lines of bold text to H2-level headers to organize the document, and add a table of contents.
- Convert this R Markdown report for Bangladesh into a parameterized report with the country’s iso3 code as its parameter. Knit a new country profile for Egypt (ISO3 code “EGY”).
Question 3
You have been given a CSV file
infant_hiv.csv that is formatted as follows:
| ISO3 | 2009 est | 2009 hi | 2009 lo | 2010 est | 2010 hi | 2010 lo |
|---|---|---|---|---|---|---|
| ALB | - | - | - | - | - | - |
| BLR | >95% | >95% | >95% | >95% | >95% | >95% |
| BLZ | 77% | 89% | 3% | 75% | 88% | 3% |
| BRA | 25% | 35% | 19% | 25% | 35% | 19% |
- The first column is ISO3 country codes.
- There are three columns for each year from 2009 to 2017. Each set has estimated, low, and high values for the year (in that order).
- A dash
-indicates that no data is available. - Our analyst tells us that
>95%means “the data is unreliable”.
Your task is to turn this into a tidy data table for further analysis:
- Describe what columns a tidy layout for this data would have and why.
- Write a function that takes the name of a file containing this table as input and returns a tidy version of the table.
- The function should replace all
-and>95%values with NA. - The body of the function may contain one or more pipelines and may create temporary or intermediate variables, but may not contain any loops.
- The function should replace all
Question 4
The file
ranking.csv contains two columns:
- The ID of an item being rated.
- A rating, which is one of “negative”, “positive”, “indifferent”, or “wtf” (meaning the respondent didn’t understand the question).
There are multiple ratings for each item.
The plot below shows this data:
- Each dot represents one item i.
- The size of the circles shows the total number of ratings for item i.
- The X coordinate for item i is the percentage of ratings for that item that are “negative”.
- The Y coordinate for item i is the percentage of ratings for that item that are “positive”.
- The regression line is created using the ‘lm’ method.
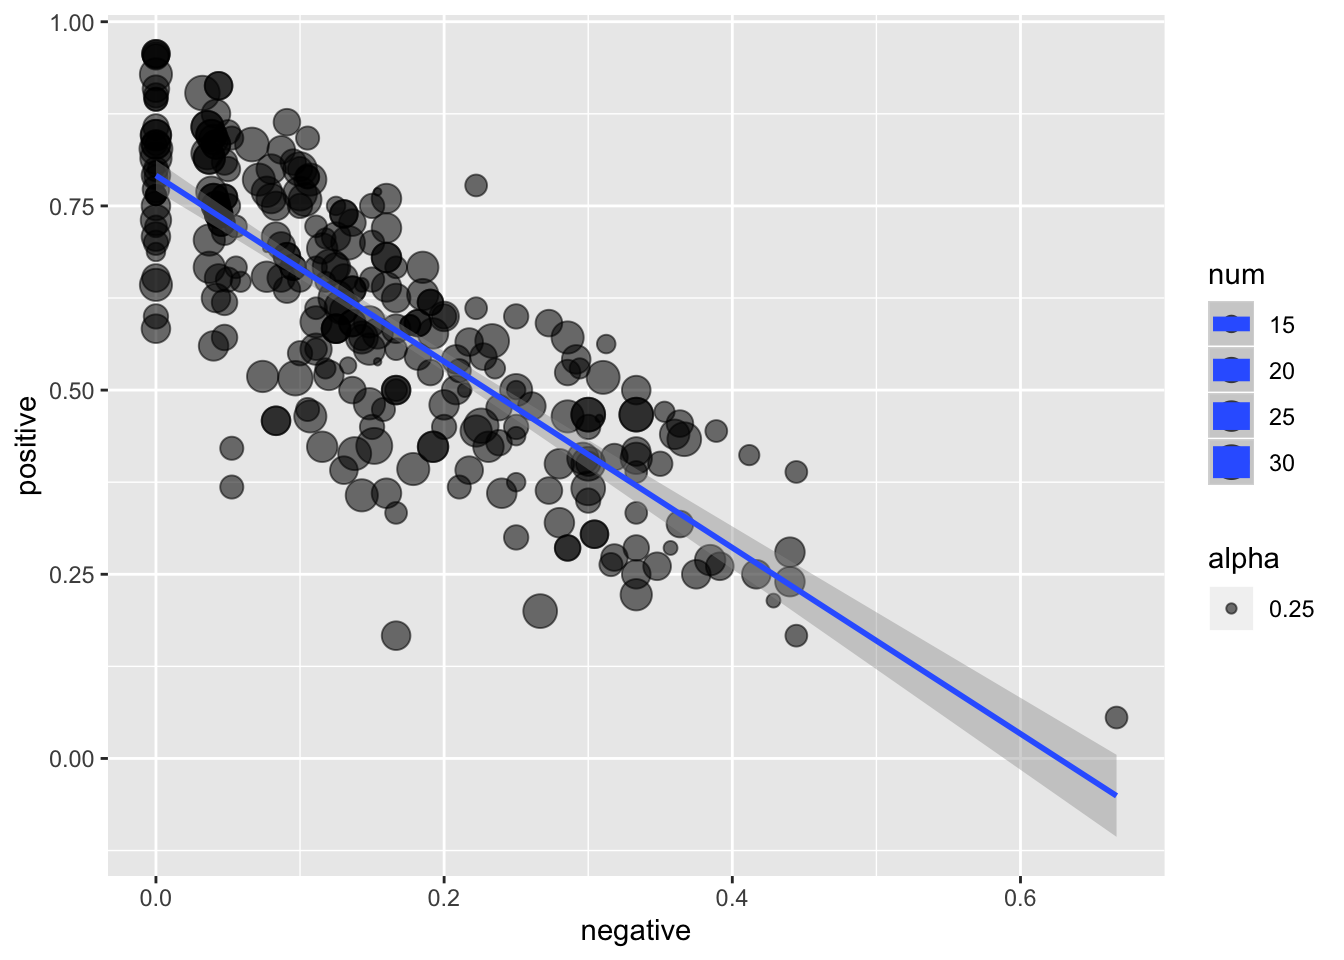
Re-create this plot using the tidyverse and ggplot2, fixing any mistakes you notice along the way.